Every KPI, live — no separate BI tool required.
Standard operational reports, interactive analytics dashboards, AI-assisted forecasting and predictive analytics — across every ERP module, against live operational data. Data lineage maintained from source transaction to dashboard so every figure is auditable.
Live KPIs, no warehouse extract
Every KPI calculated against live operational data. No BI tool to license, no nightly ETL, no delayed refresh. The dashboard reads the same metadata repository the operation writes to.
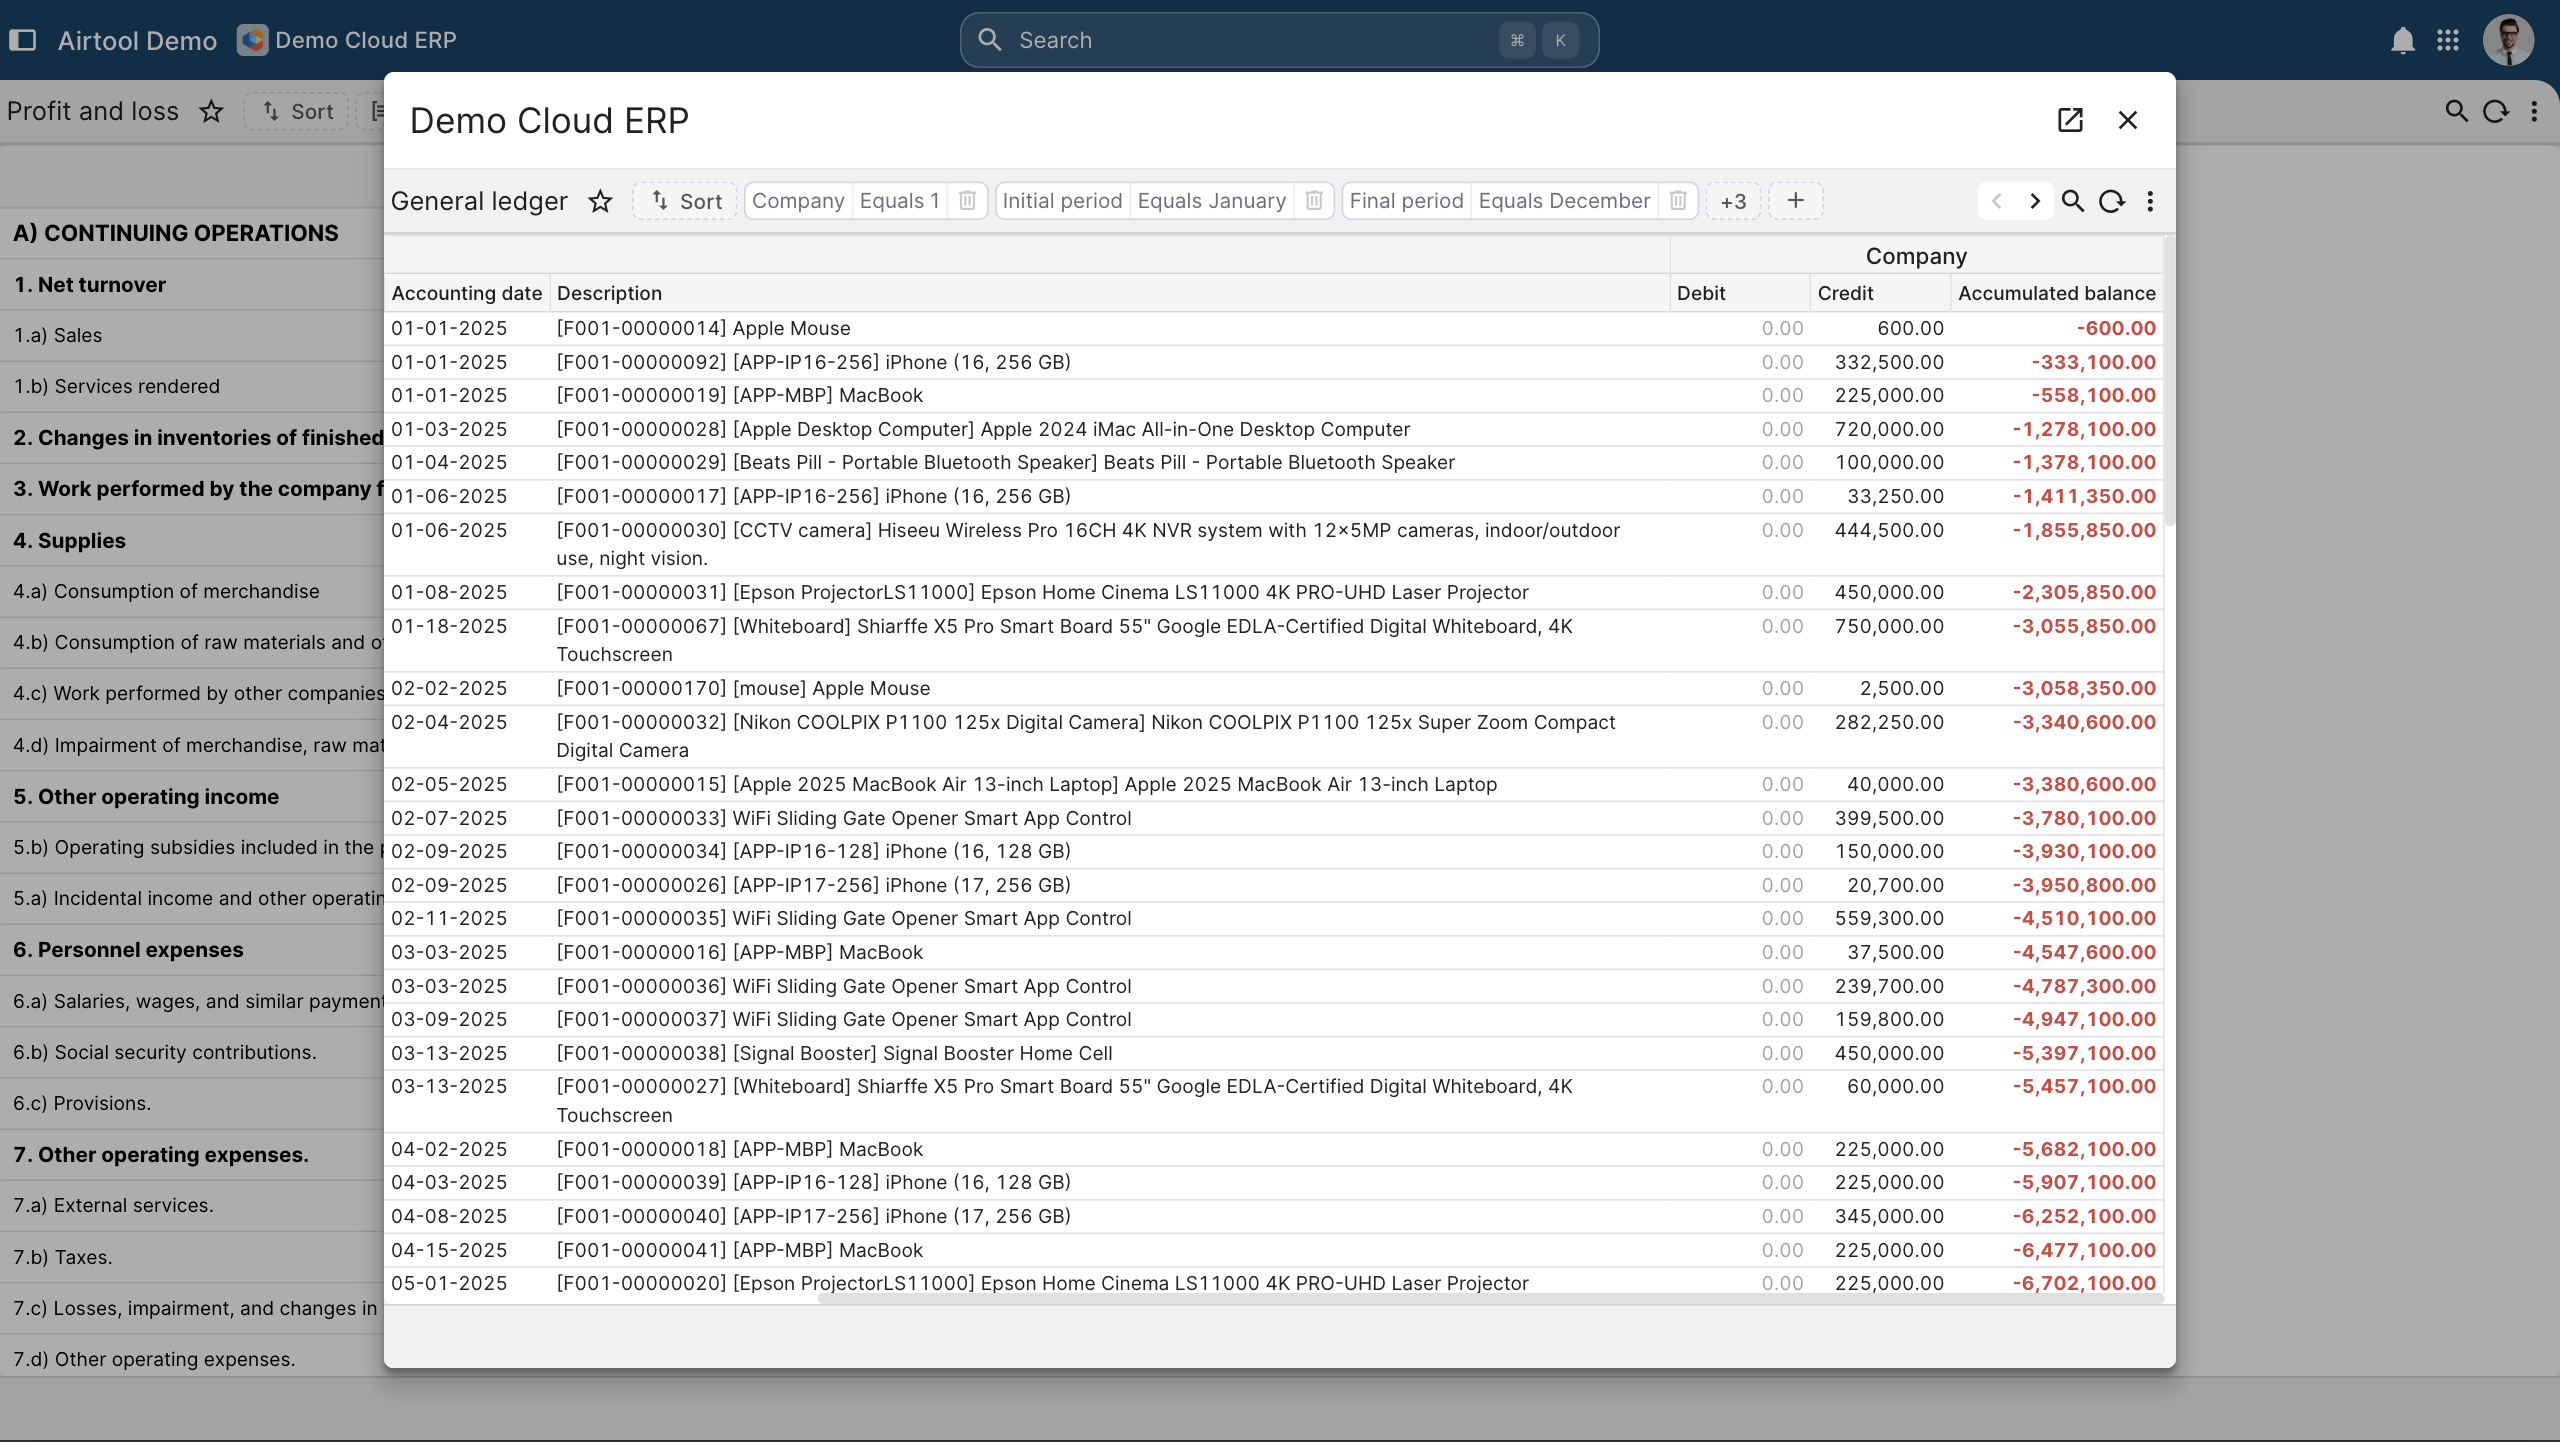
Drill-through to every record
From total to subtotal to record to underlying transaction. Drill-through preserves user permissions; the analyst sees only what the role allows.
AI-assisted analysis
Forecasts, anomaly detection, natural-language report generation under role-based access. The AI cannot reach data the user cannot reach — by construction.
Statutory-format output
P&L, balance sheet, cash flow, statutory filings — generated in the format the regulator or auditor expects. Scheduling, export and distribution all in-system.
The reports the business actually runs the business with.
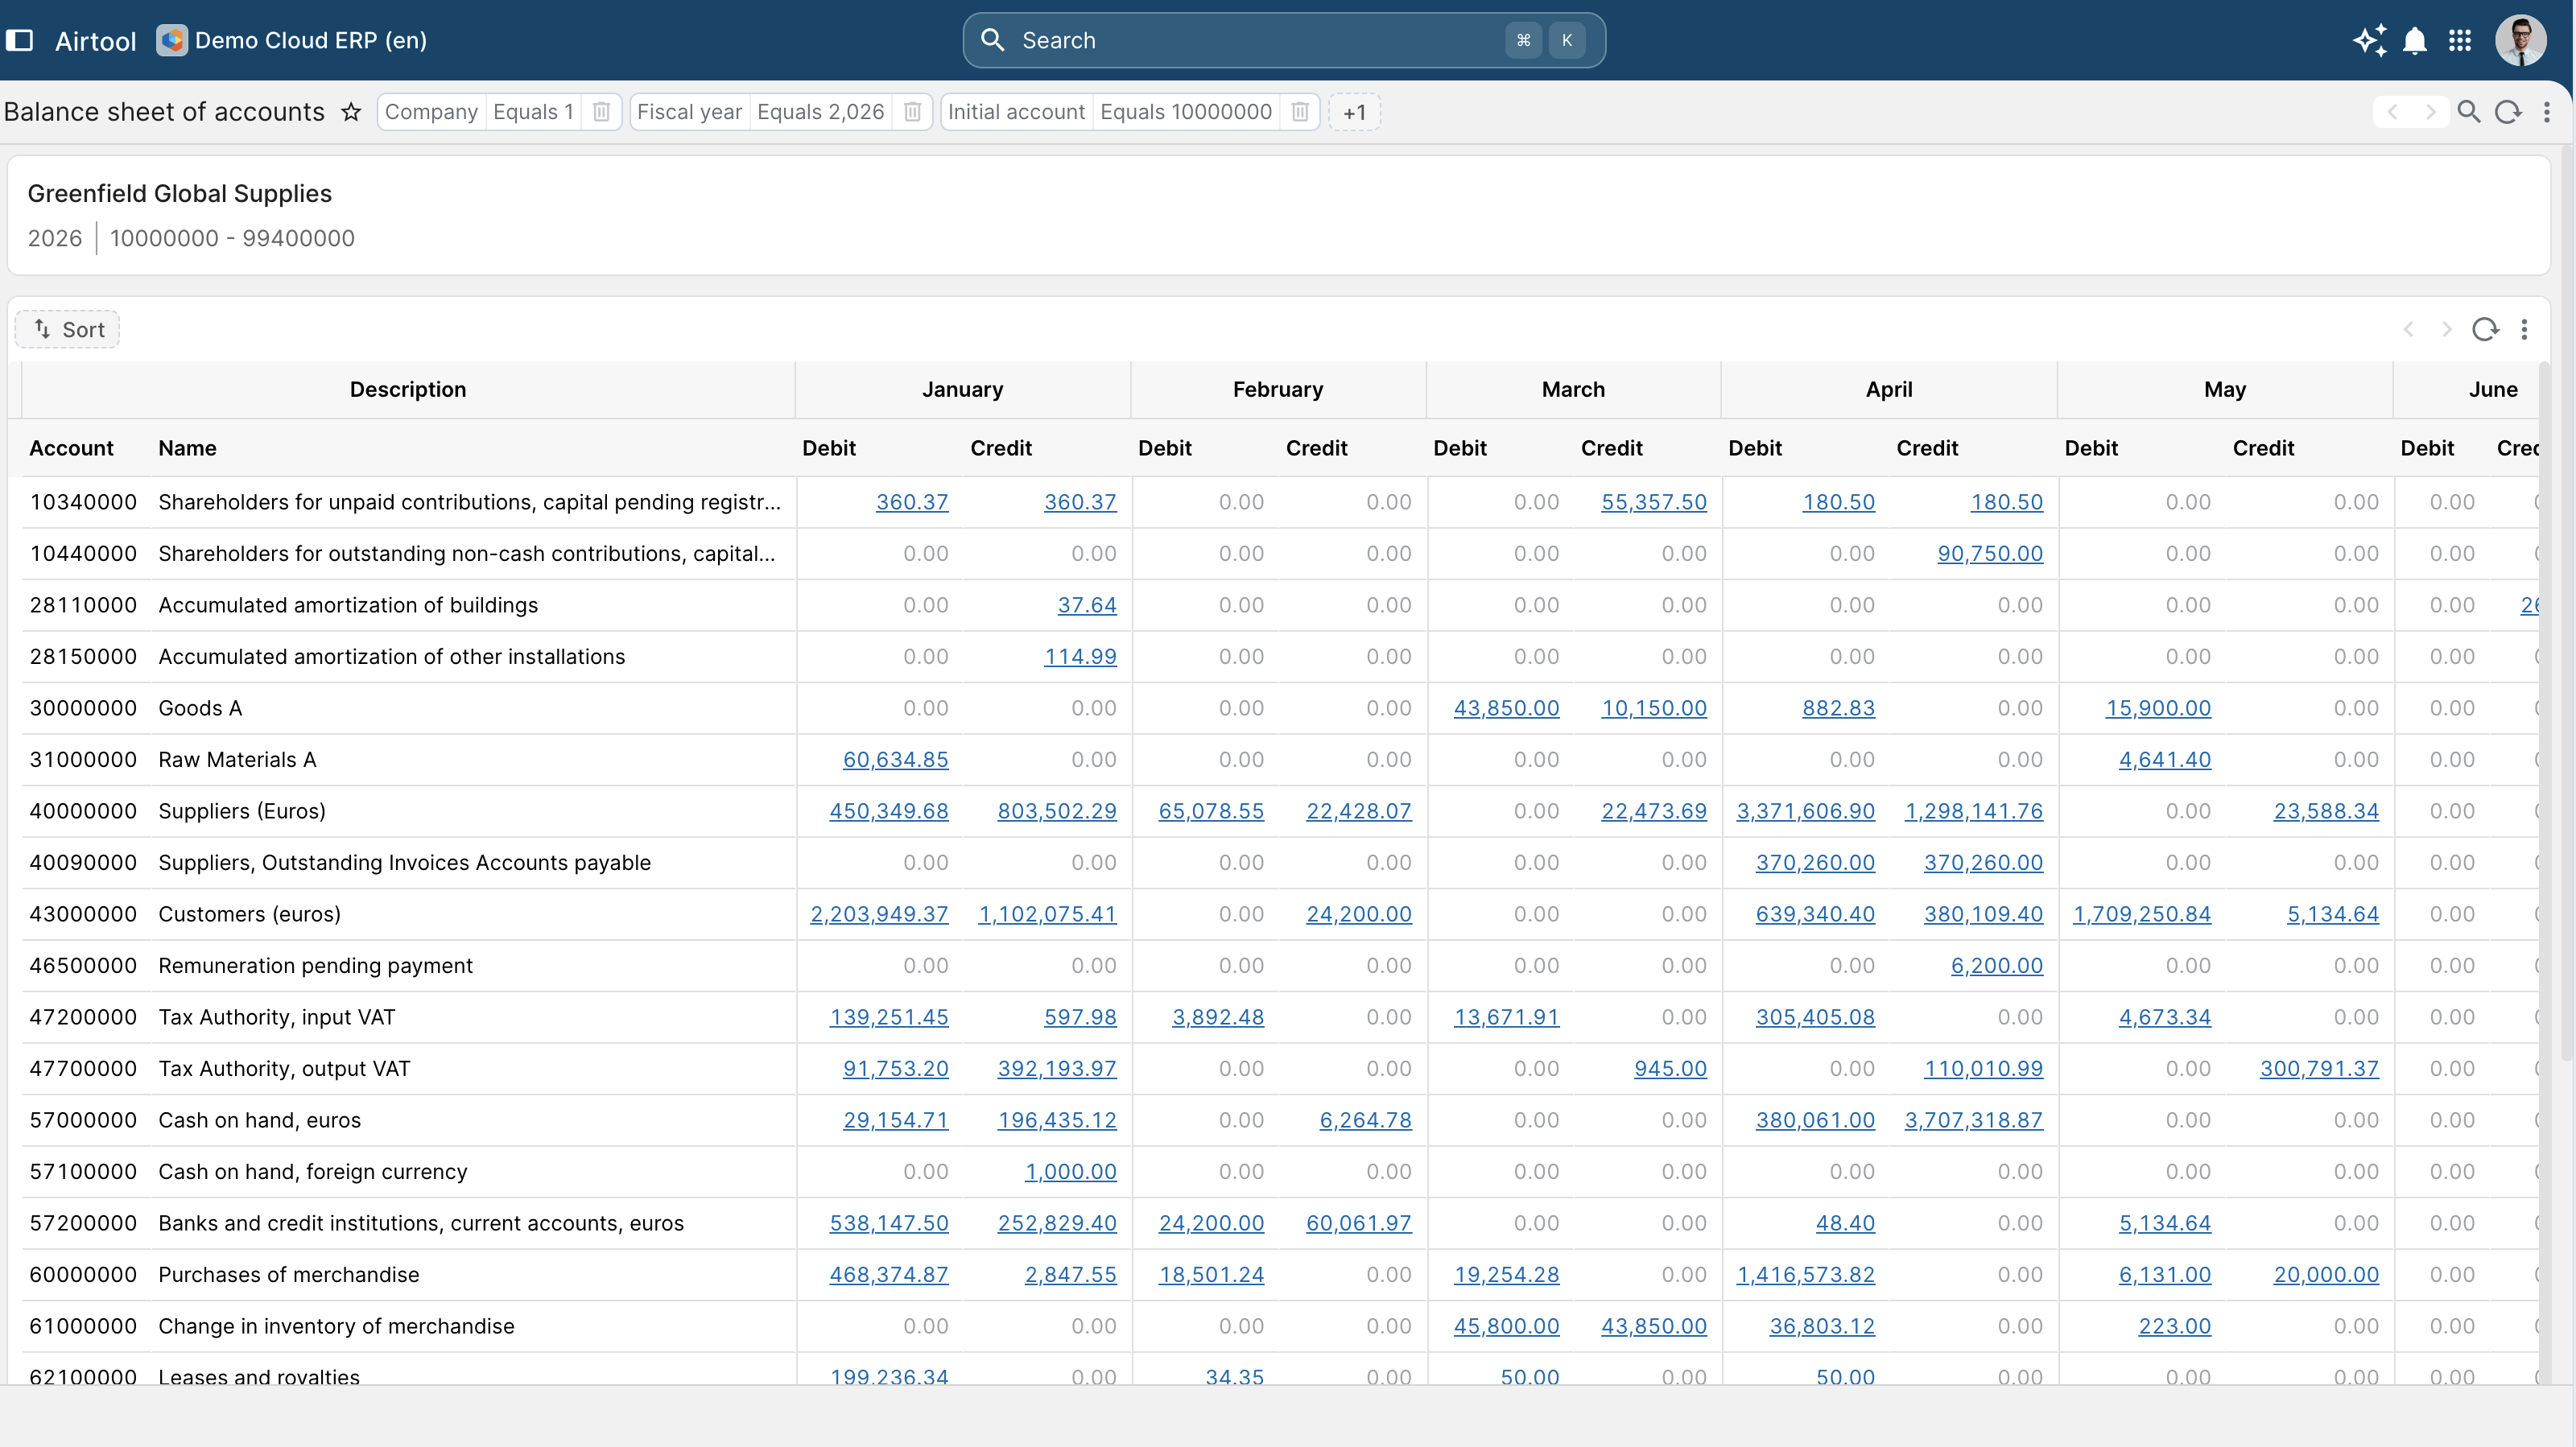
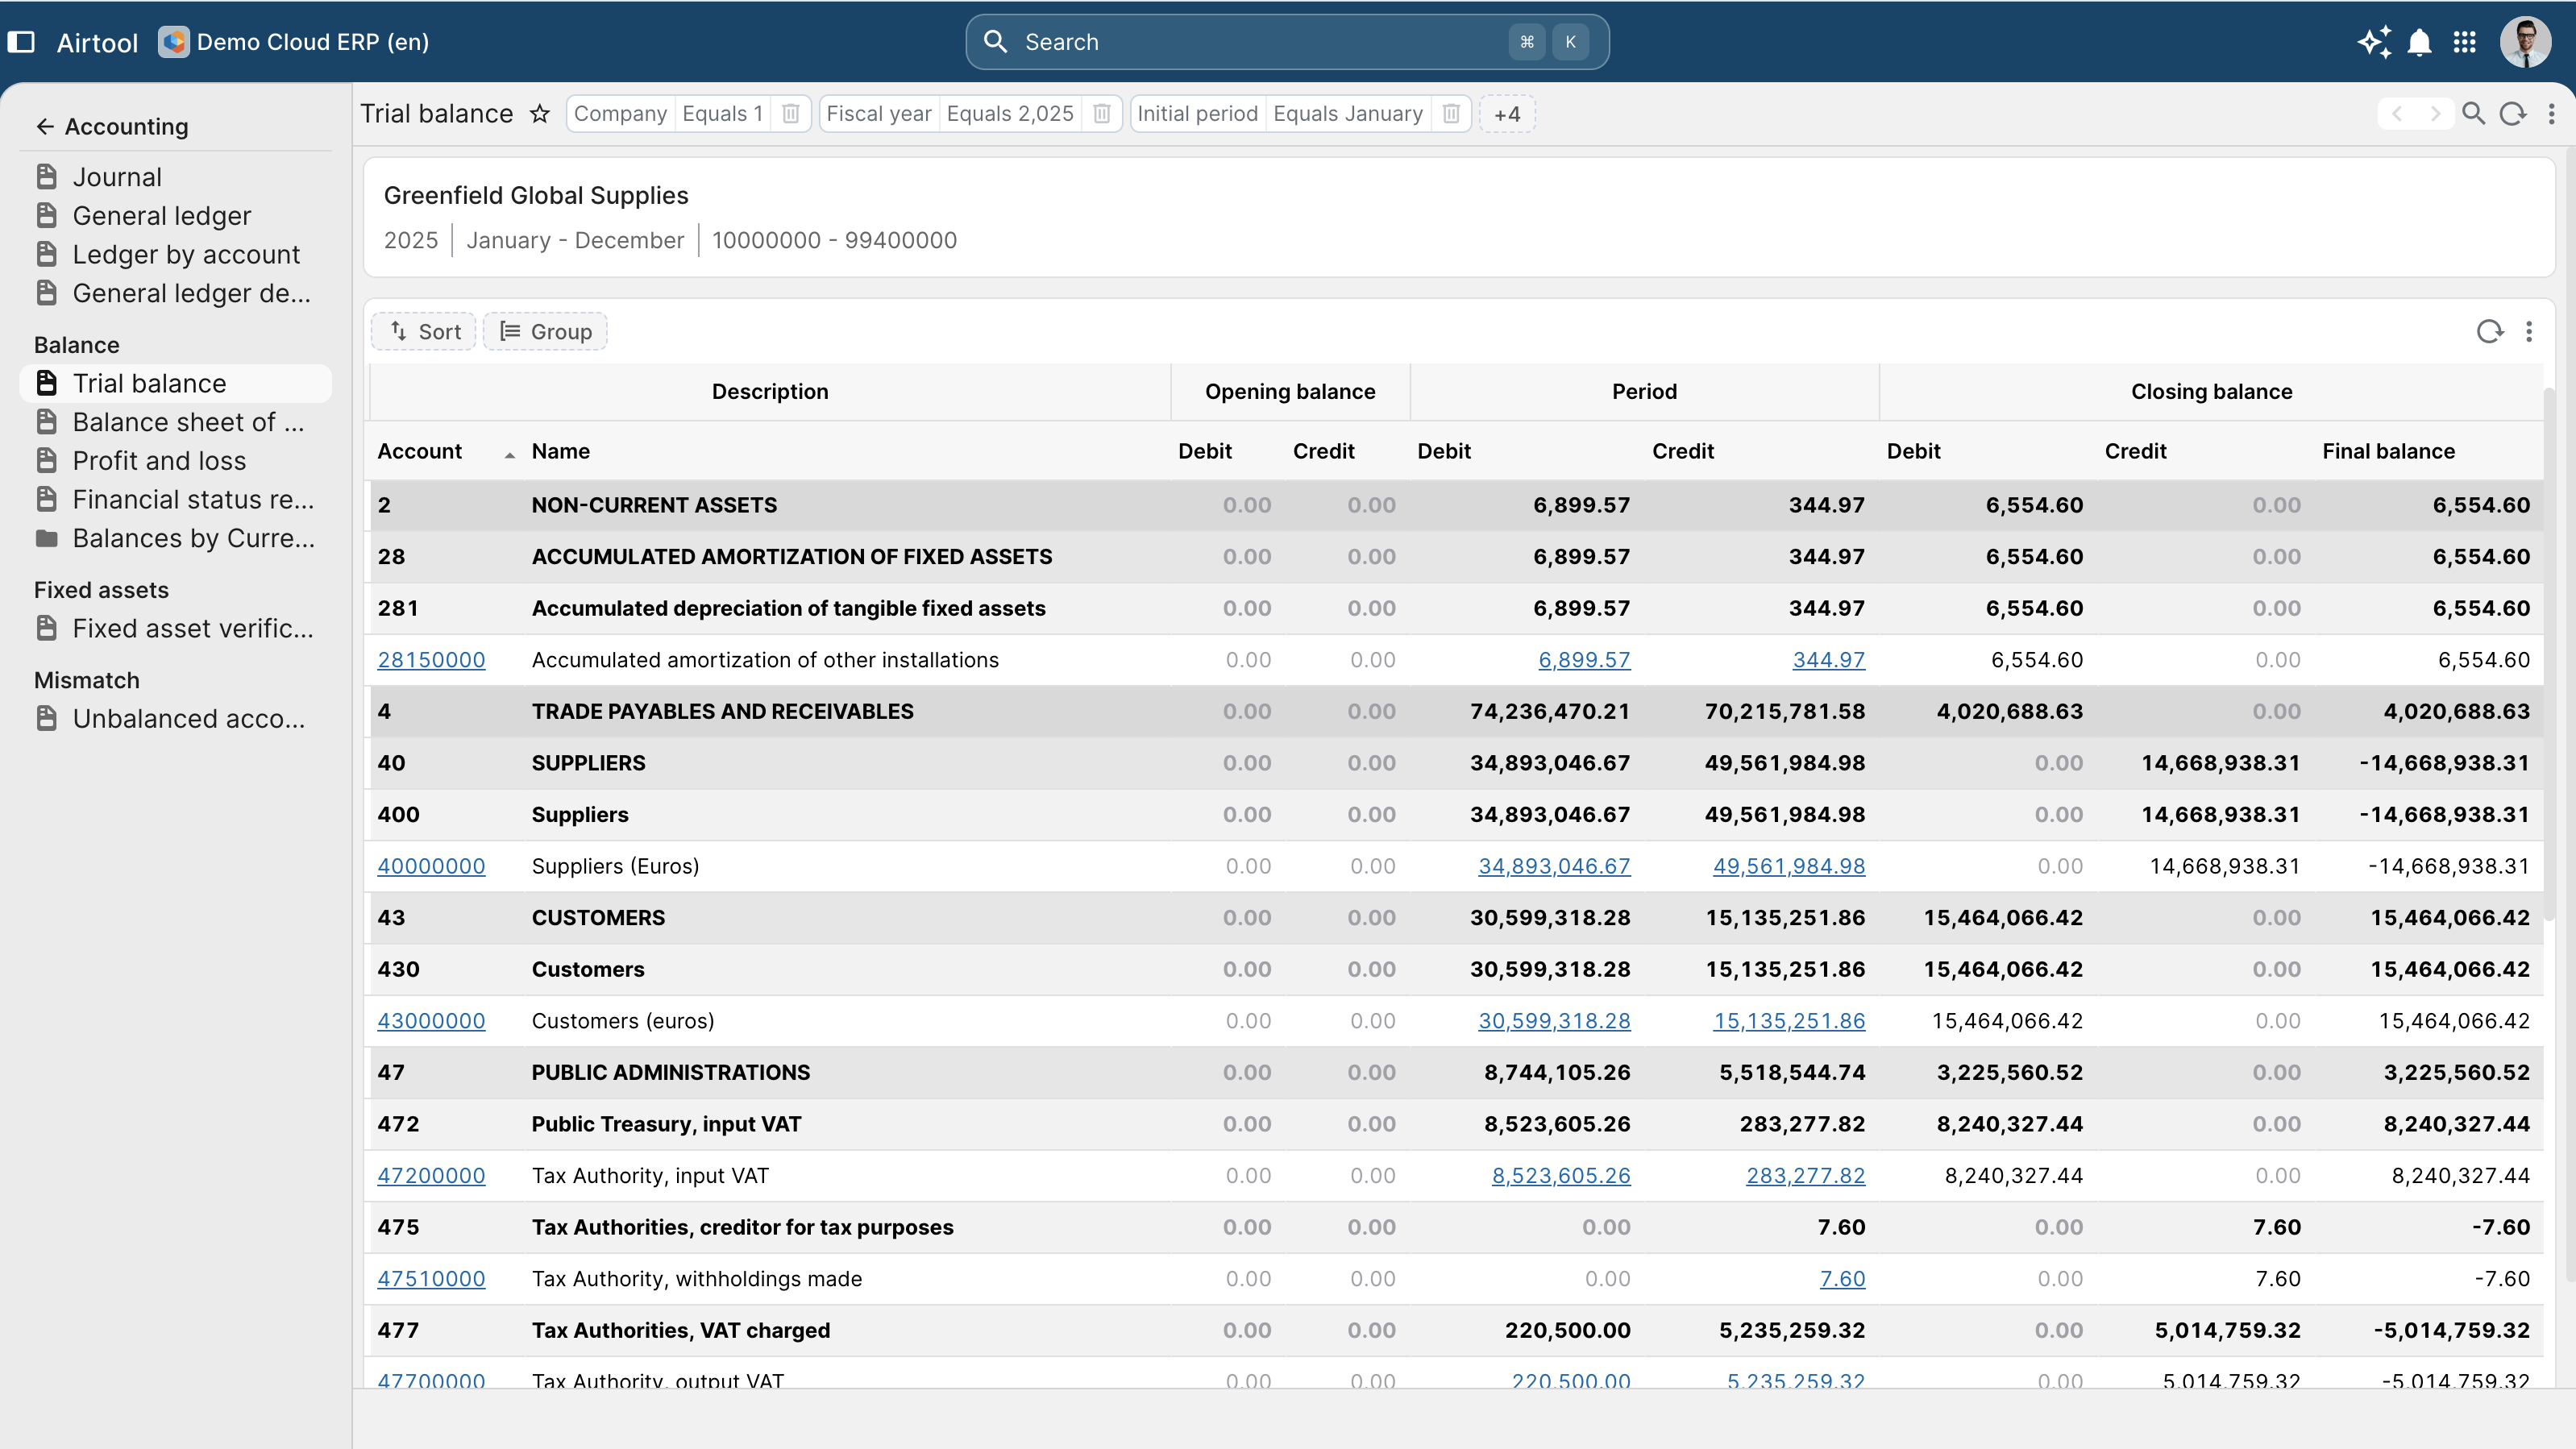
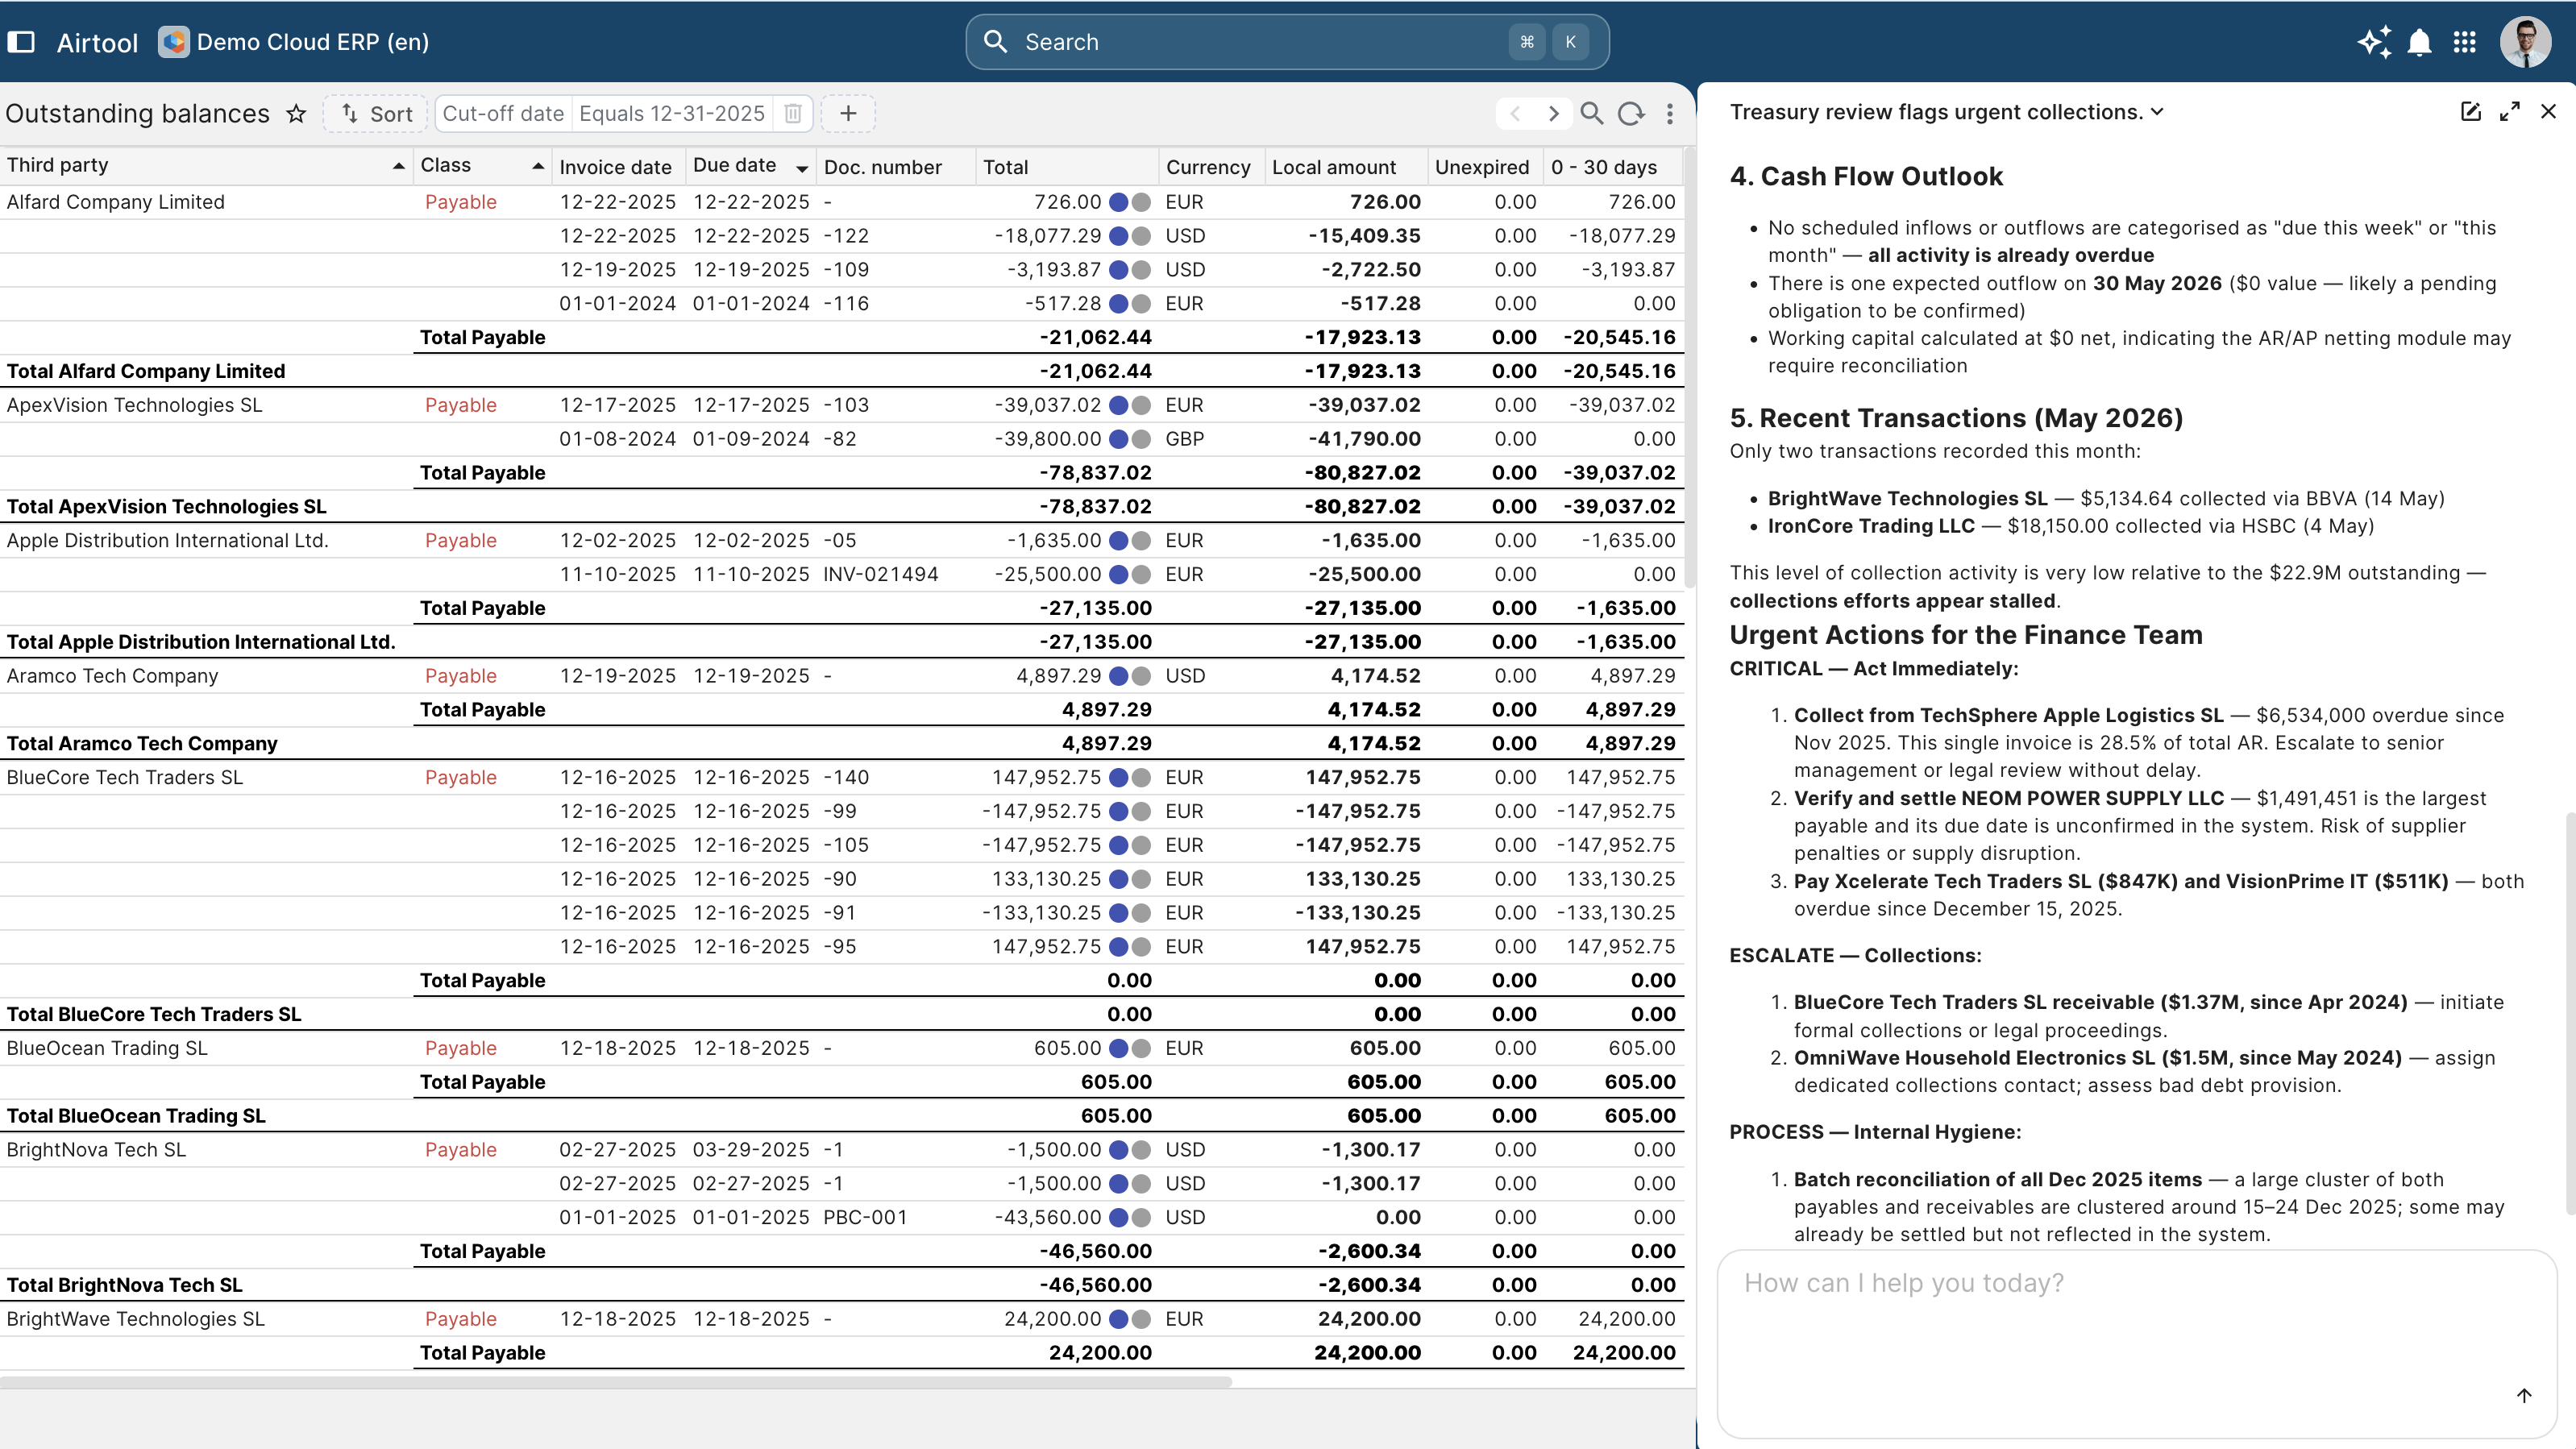
P&L, balance sheet, cash flow, aged-debtor, aged-creditor, trial balance, GL detail — at the entity, group or consolidated level. Configured once per jurisdiction. Sales register, supplier ageing, stock position, work-in-progress, production yield, payroll register — all running against live operational data. Period-end packs scheduled, generated, distributed and archived. Same engine handles board pack, audit pack and regulator filing. PDF (statutory archival), XLSX, CSV, XML and country-specific regulator formats. Output channel a runtime parameter, not a redesign.
- Pre-built financial reports — P&L, balance sheet, cash flow, aged-debtor, aged-creditor, trial balance, GL detail — at the entity, group or consolidated level. Configured once per jurisdiction.
- Operational reports — Sales register, supplier ageing, stock position, work-in-progress, production yield, payroll register — all running against live operational data.
- Scheduled report packs — Period-end packs scheduled, generated, distributed and archived. Same engine handles board pack, audit pack and regulator filing.
- Multi-format export — PDF (statutory archival), XLSX, CSV, XML and country-specific regulator formats. Output channel a runtime parameter, not a redesign.
Executive and operational KPIs, with drill-through to source.
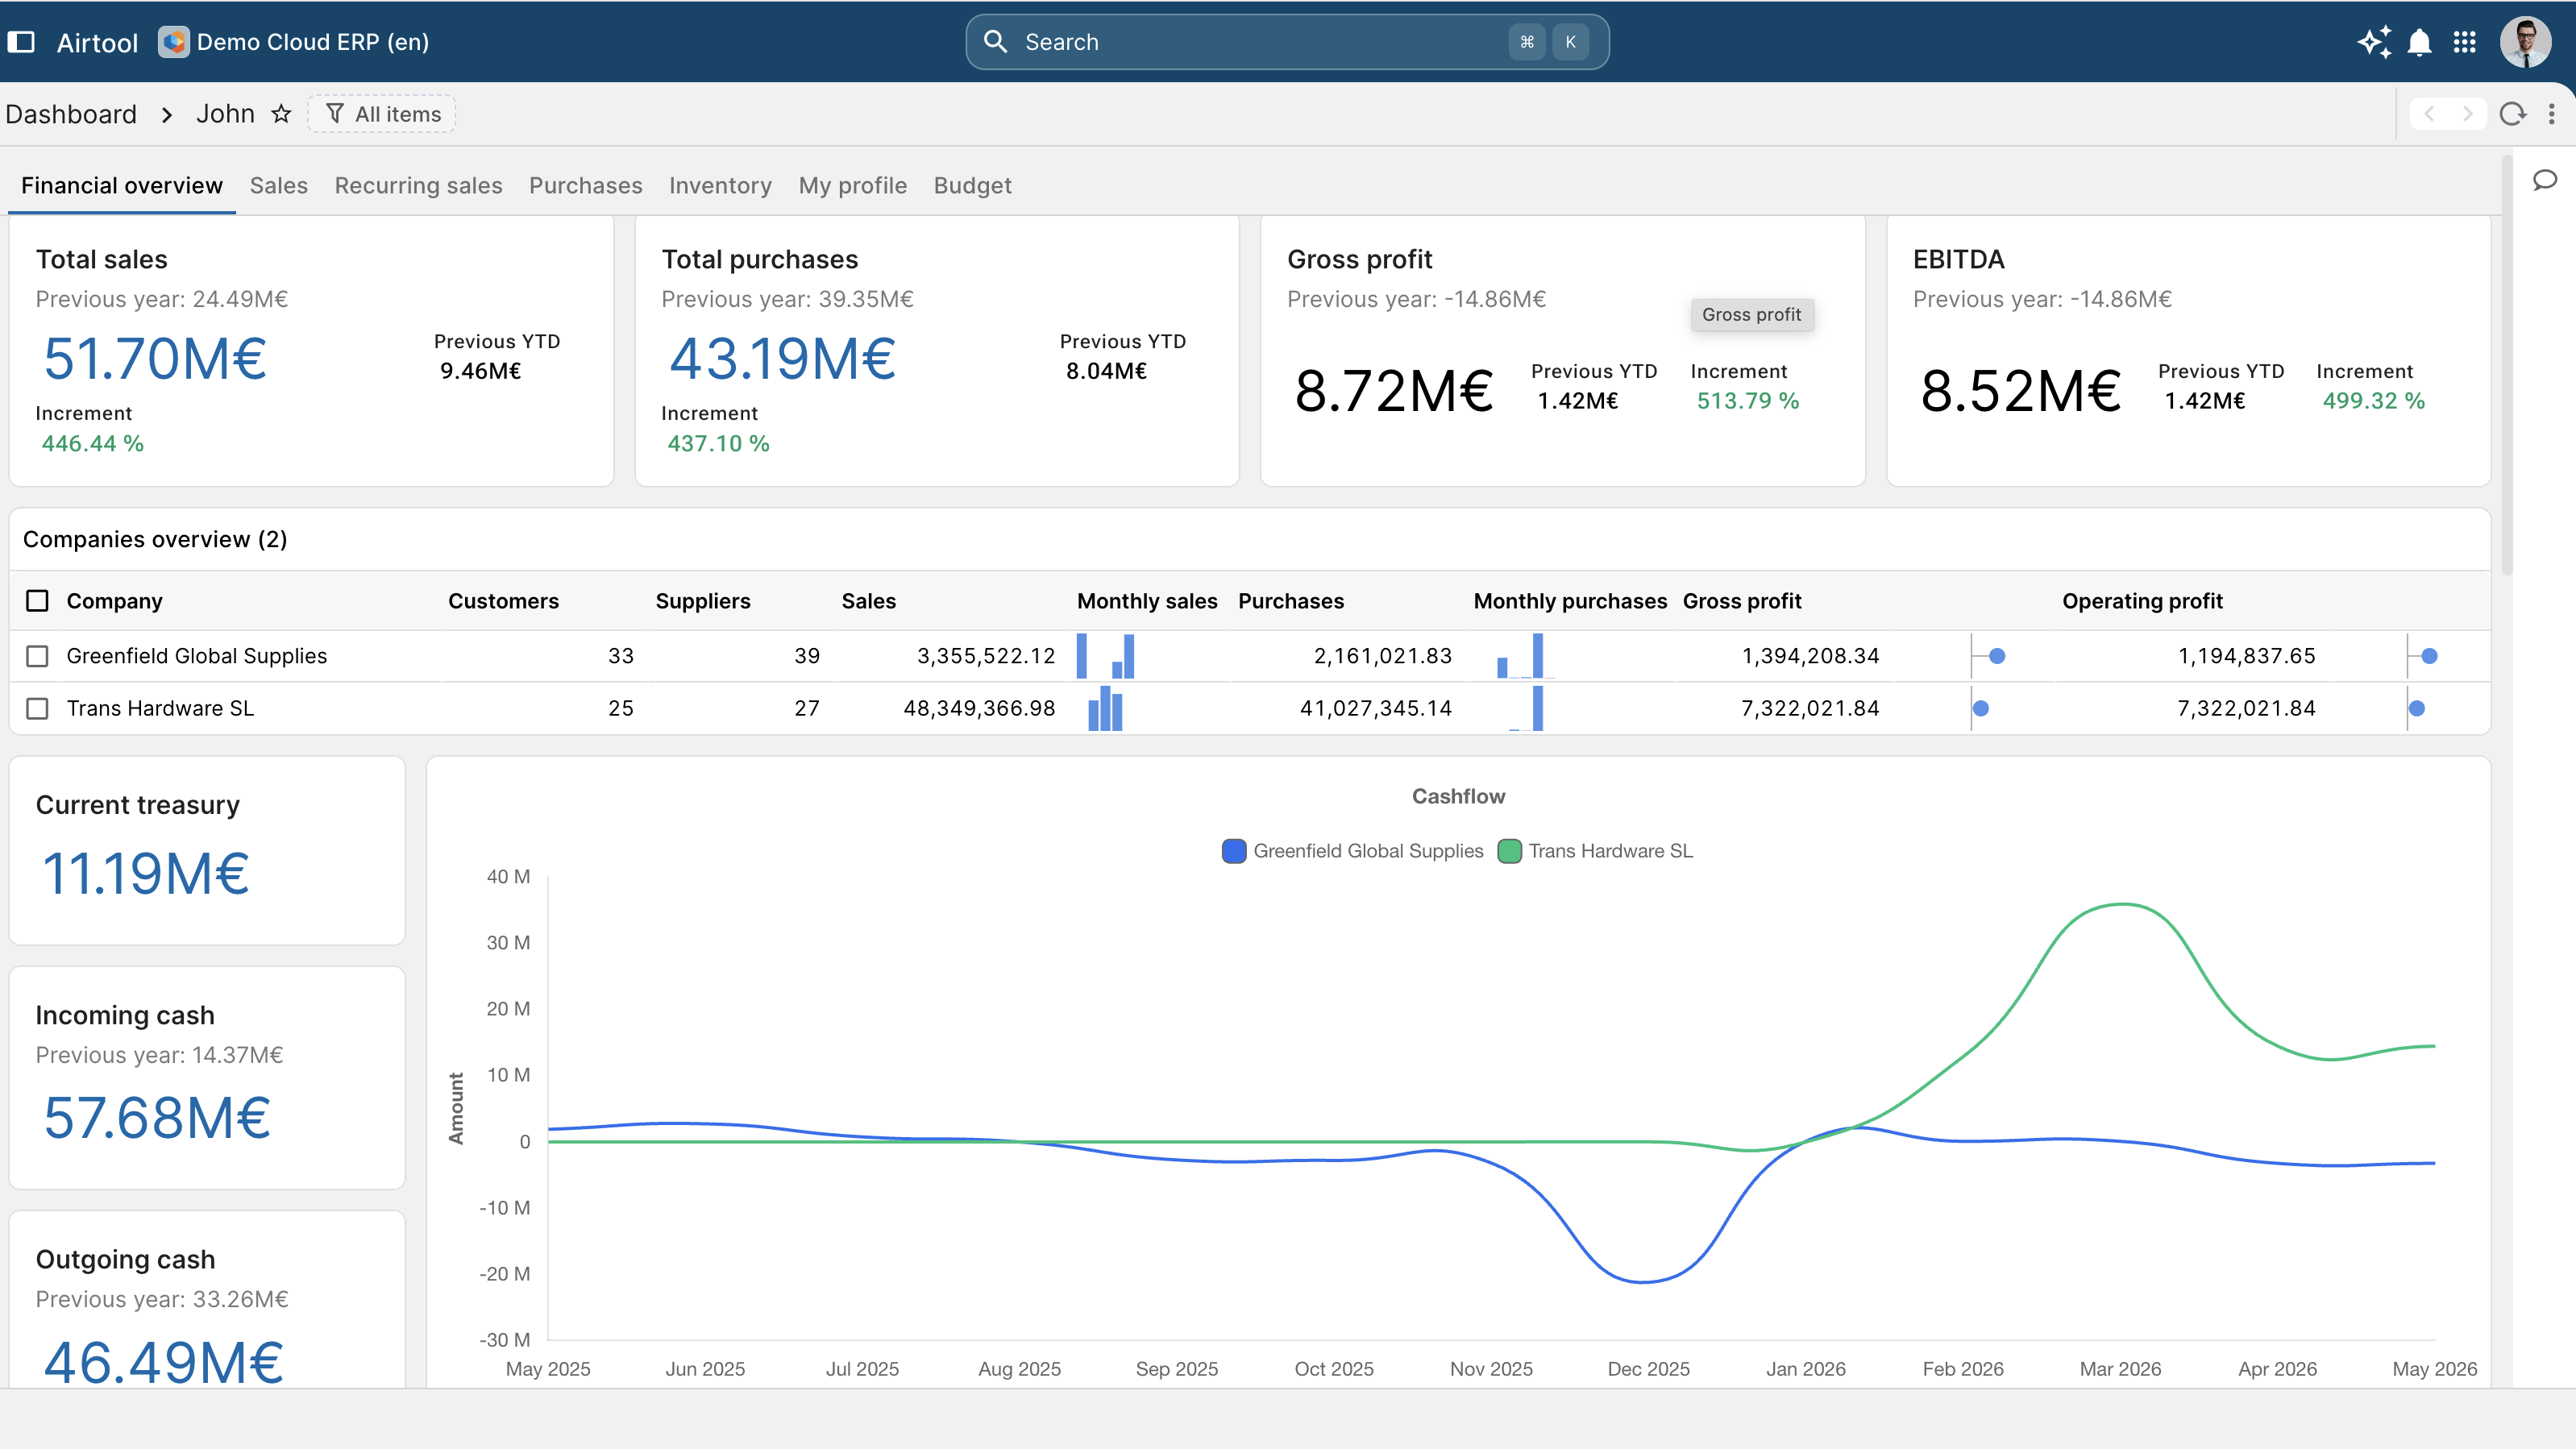
Executive, finance, operations, sales and HR dashboards configured per role. The role's permission perimeter applies to the dashboard the same way it applies to the screens. Every chart, every KPI, every total drillable to underlying transactions. The audit trail is the drill path. Pivot across entity, department, project, cost centre, period, currency. The same pivot engine for ad-hoc analysis as for formal reports. Custom calculations, year-on-year, period-over-period, forecast-vs-actual and what-if scenarios configured in the metadata repository. The custom KPI is a metadata-repository row, not a code change.
- Role-based dashboards — Executive, finance, operations, sales and HR dashboards configured per role. The role's permission perimeter applies to the dashboard the same way it applies to the screens.
- Drill-through to record — Every chart, every KPI, every total drillable to underlying transactions. The audit trail is the drill path.
- Multi-dimensional pivot — Pivot across entity, department, project, cost centre, period, currency. The same pivot engine for ad-hoc analysis as for formal reports.
- Custom KPIs — Custom calculations, year-on-year, period-over-period, forecast-vs-actual and what-if scenarios configured in the metadata repository. The custom KPI is a metadata-repository row, not a code change.
Predictive analytics, inside the role's permission perimeter.
Forecast models trained on historical operational data. Confidence intervals visible; the model's reasoning explainable; the recommendation auditable. Unusual journal entries, outlier purchase requests, abnormal stock movements flagged for review. Threshold and learning configurable per category. Ask a question in plain language; the AI generates the XDBL query; the compiler emits the native SQL with the user's security injected; the answer is the same answer the user would have got from a manual query. Forward-looking scenarios — recession case, growth case, currency shock, supplier loss — run against the live operating model. Outputs auditable; assumptions documented.
- Demand and revenue forecasting — Forecast models trained on historical operational data. Confidence intervals visible; the model's reasoning explainable; the recommendation auditable.
- Anomaly detection — Unusual journal entries, outlier purchase requests, abnormal stock movements flagged for review. Threshold and learning configurable per category.
- Natural-language reporting — Ask a question in plain language; the AI generates the XDBL query; the compiler emits the native SQL with the user's security injected; the answer is the same answer the user would have got from a manual query.
- Scenario and what-if — Forward-looking scenarios — recession case, growth case, currency shock, supplier loss — run against the live operating model. Outputs auditable; assumptions documented.
Every figure on every report, traceable to its source.
Every figure traces from dashboard cell through pivot calculation to source records. Lineage queryable; auditor satisfiable. Reports calculate against live operational data. No "as-of last refresh" delay; no overnight ETL window; no stale dashboard. The same report shows different data to different roles. Security injected at compile time, not at the application layer; the lookup cannot escape the perimeter. Reports reproducible against any historical period — same ledger state, same approvals, same evidence — for the auditor's working file.
- Source-to-dashboard lineage — Every figure traces from dashboard cell through pivot calculation to source records. Lineage queryable; auditor satisfiable.
- Live calculation, not cached — Reports calculate against live operational data. No "as-of last refresh" delay; no overnight ETL window; no stale dashboard.
- Role-aware visibility — The same report shows different data to different roles. Security injected at compile time, not at the application layer; the lookup cannot escape the perimeter.
- Audit-grade output — Reports reproducible against any historical period — same ledger state, same approvals, same evidence — for the auditor's working file.
Built on the supervised platform.
The reporting layer reads from the same metadata repository the application writes to. No data warehouse, no ETL, no refresh lag. The dashboard is observability as SQL — the same architectural property the platform applies to the runtime applies to the business state. The auditor and the CFO see the same figures because they are the same query against the same data.