Two kinds of map, and most enterprise data needs the second one.
A geographic map places markers, shaded regions, density and tracks on real cartography, for subjects that genuinely have a position on the earth. A schematic map takes a drawing — a floor plan, a seat map, a cut diagram, a plant schematic, a wiring layout — names its regions to match a column, and colours each one from the query. Both are view types over an ordinary query, because the geometry is a column in the operational database rather than an export to a mapping tool.
Geographic — a position on the earth
For subjects that genuinely have one. The geometry is a column in the operational database, so the map is a view over an ordinary query and the base layer is a choice rather than a dependency.
Geography as a measure, not a decoration
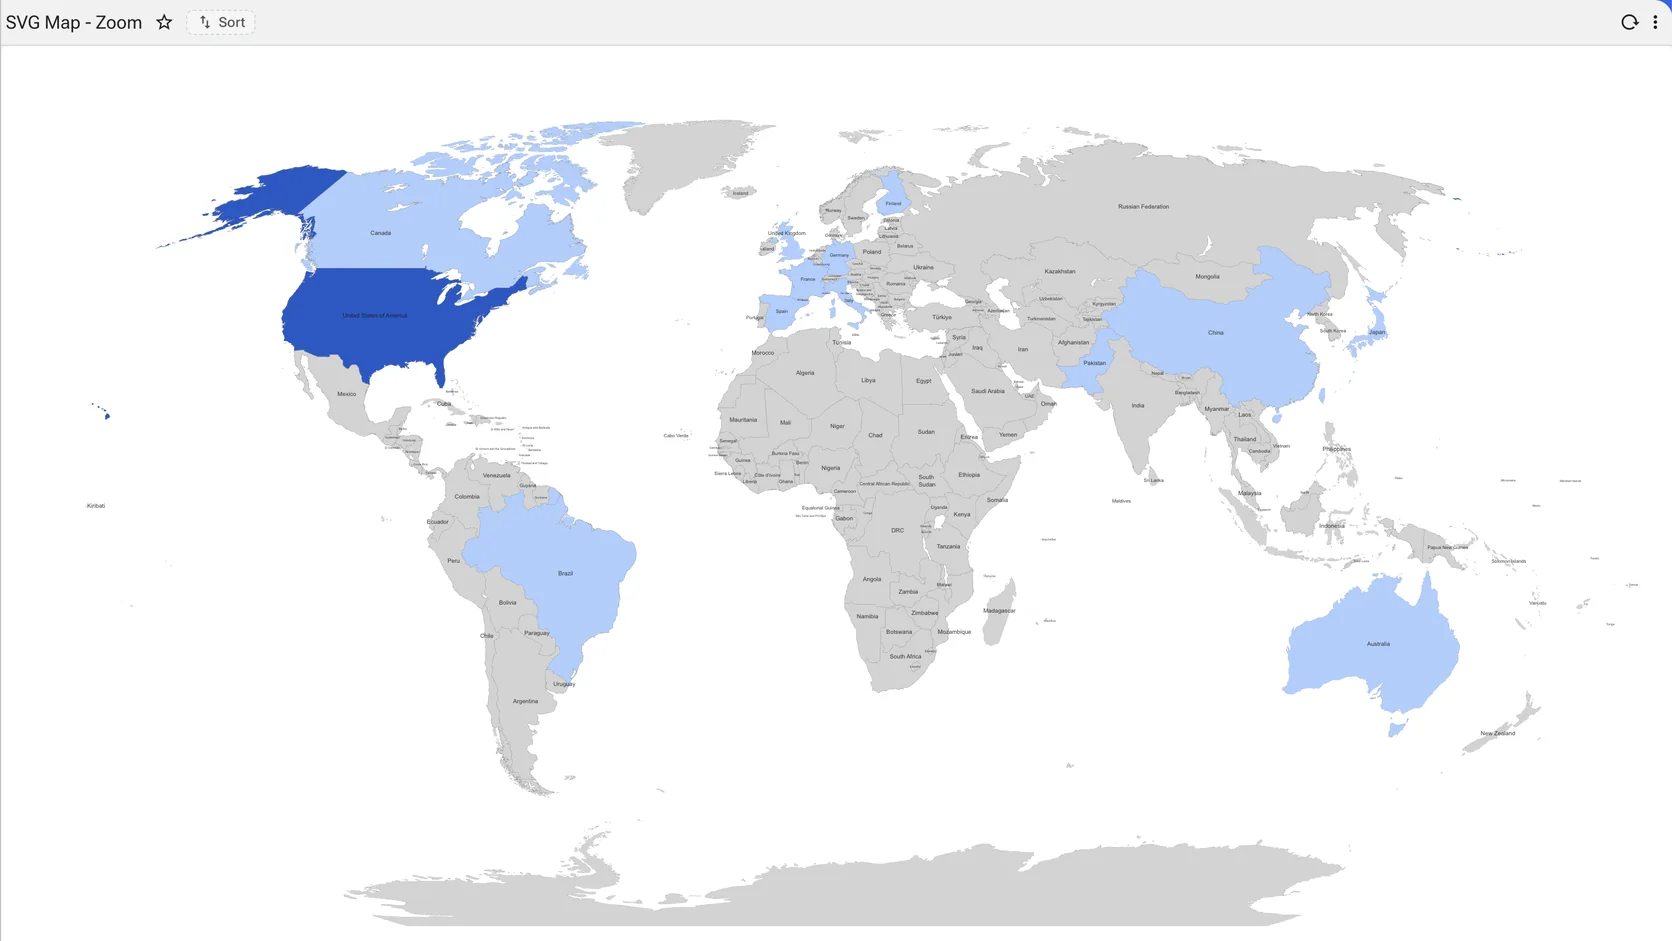
Countries shaded by whatever the query returns, so scale reads as intensity. Zoom, fit-to-data, minimap, legend and a choice of palette are settings on the view rather than a separate mapping tool. Reach for it when the subject has coordinates and distance between points is meaningful.
Territories shaded from the query, on the tile provider you choose
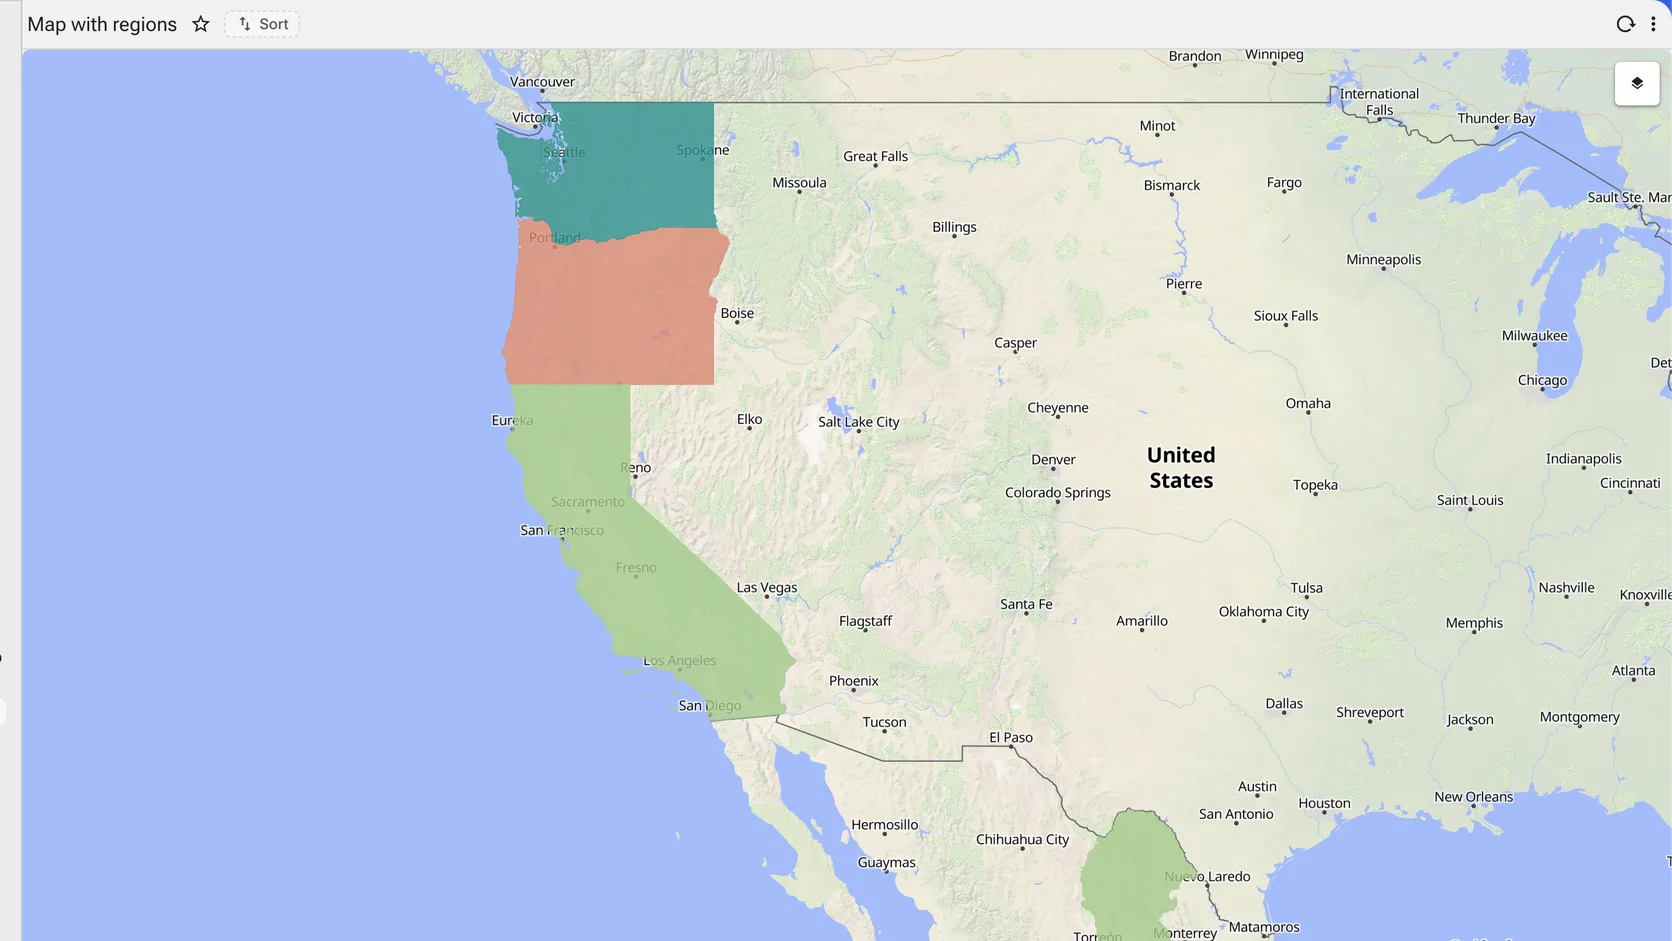
The same region view over OpenStreetMap rather than a commercial tile service — no key, no per-view billing, and the cartography detail that street-level operations need. Sales territories, service areas, franchise boundaries and delivery zones are shaded by whatever the query returns. Reach for it when the measure belongs to an administrative area rather than to a point.
Schematic — a position that is not on the earth
The other half of spatial, and a different thing entirely. Supply a drawing, name its regions to match a column, and every region takes its colour from the query. Most enterprise data that has a position has this kind of position.
Where the subject is not geography, supply the picture
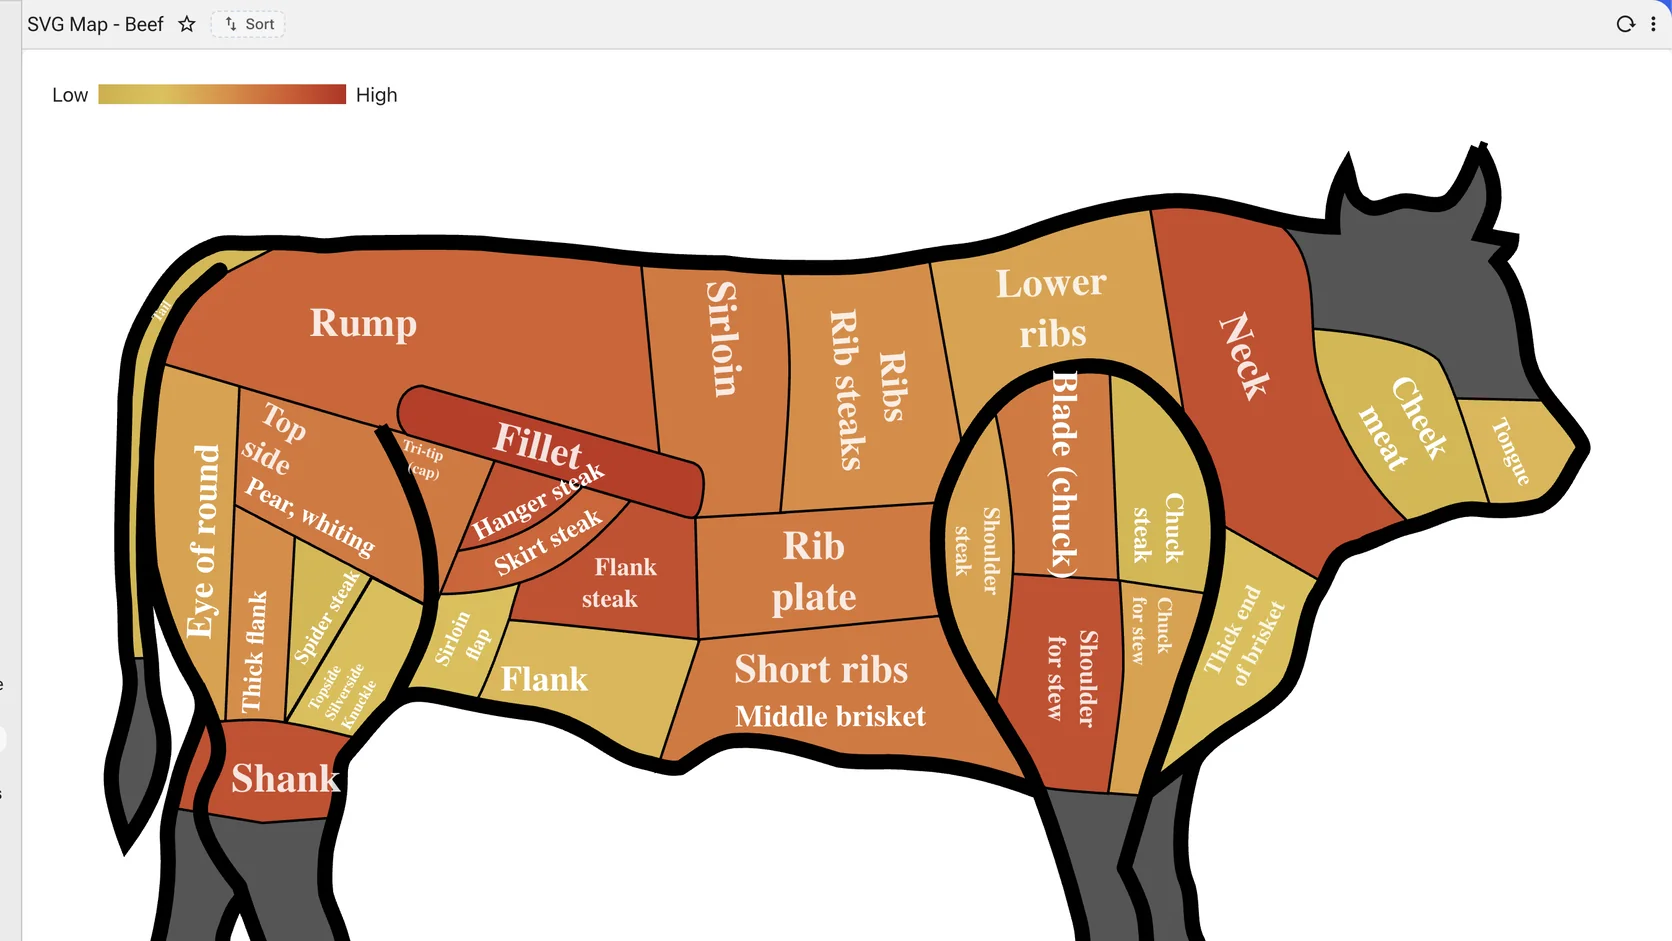
Hand the platform an SVG and name its regions to match a column: a cut diagram, a floor plan, a seat map, a plant schematic, a wiring layout. Every region takes its colour from the query. Yield per cut, occupancy per seat, downtime per machine — read on the picture the business already uses rather than on a bar chart standing in for it. Reach for it when the subject has a real position inside something that is not a map — a building, a vehicle, a plant, a carcass, a room.
Inventory that has a physical position
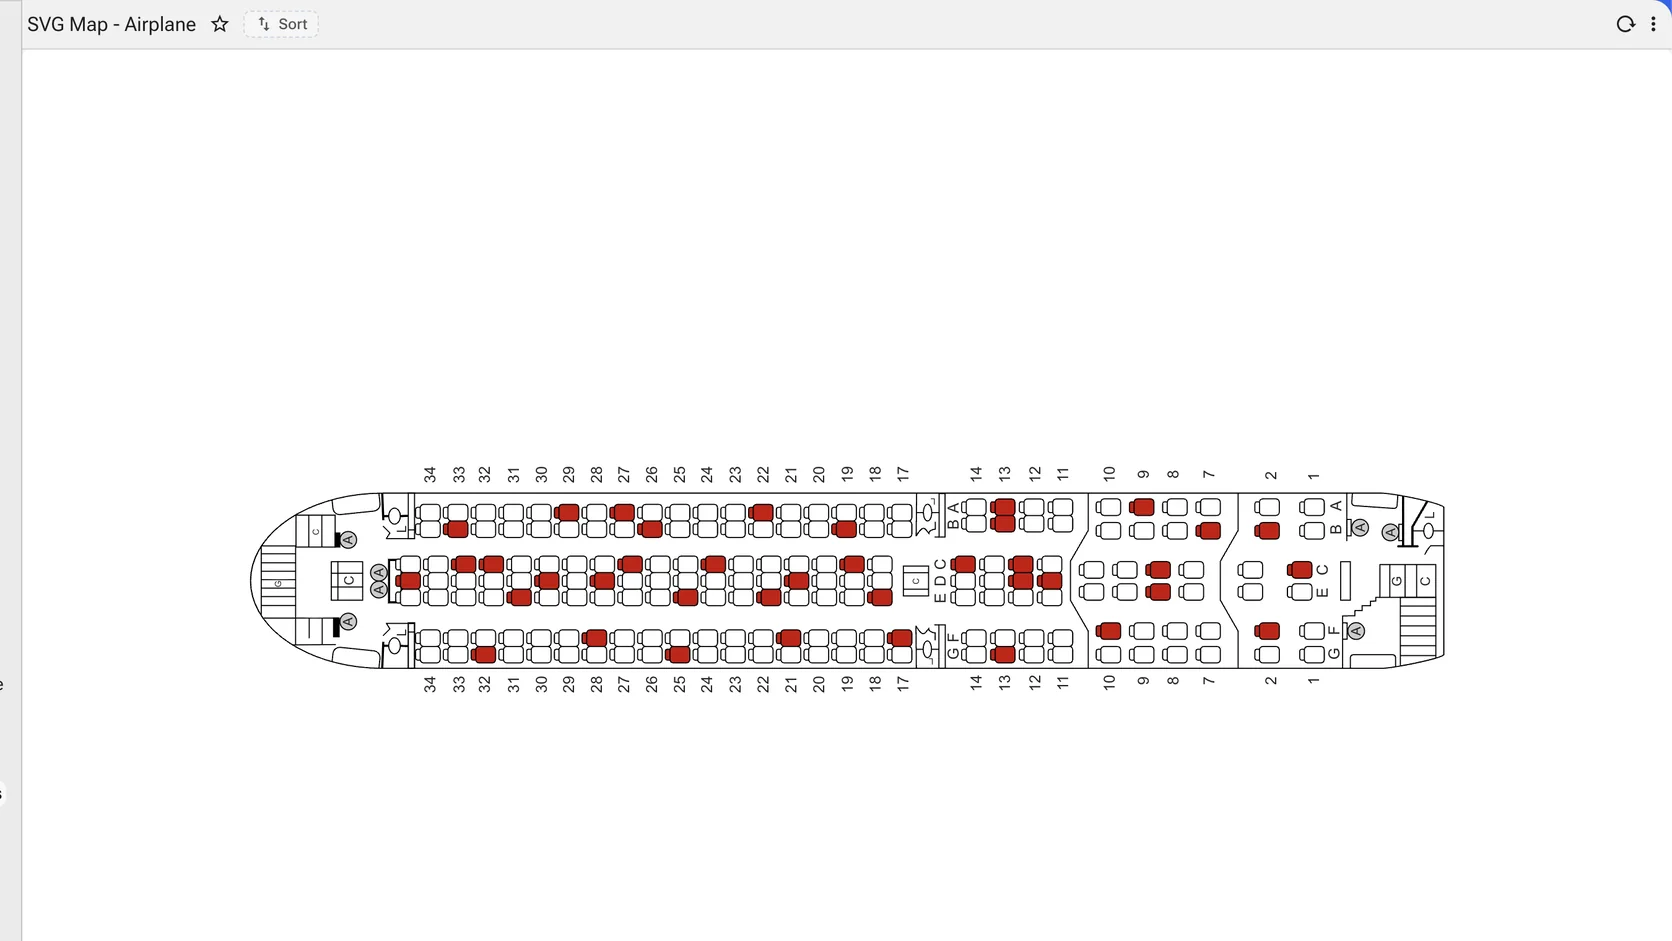
Every seat in the cabin, occupied ones filled. The same component that shaded a cut diagram shades a floor plan — and the reason it matters is that some inventory is only comprehensible in its own geometry. A seat, a bay, a berth, a bed, a rack unit or a parking space is not a row in a list to the person allocating it. Reach for it when inventory has a fixed physical position and the reader thinks in that geometry rather than in a list of codes.