The application is composed in a visual editor, in the same browser it runs in.
A palette of components on the left, a canvas of five layout regions in the middle, and a property panel on the right that binds the selected component to a database column or to a dataset. Forms, dashboards, reports and the server-side scripts behind them are authored through the same surface, against the same metadata repository. Save the artefact and the next request renders it: no build, no restart, no window.
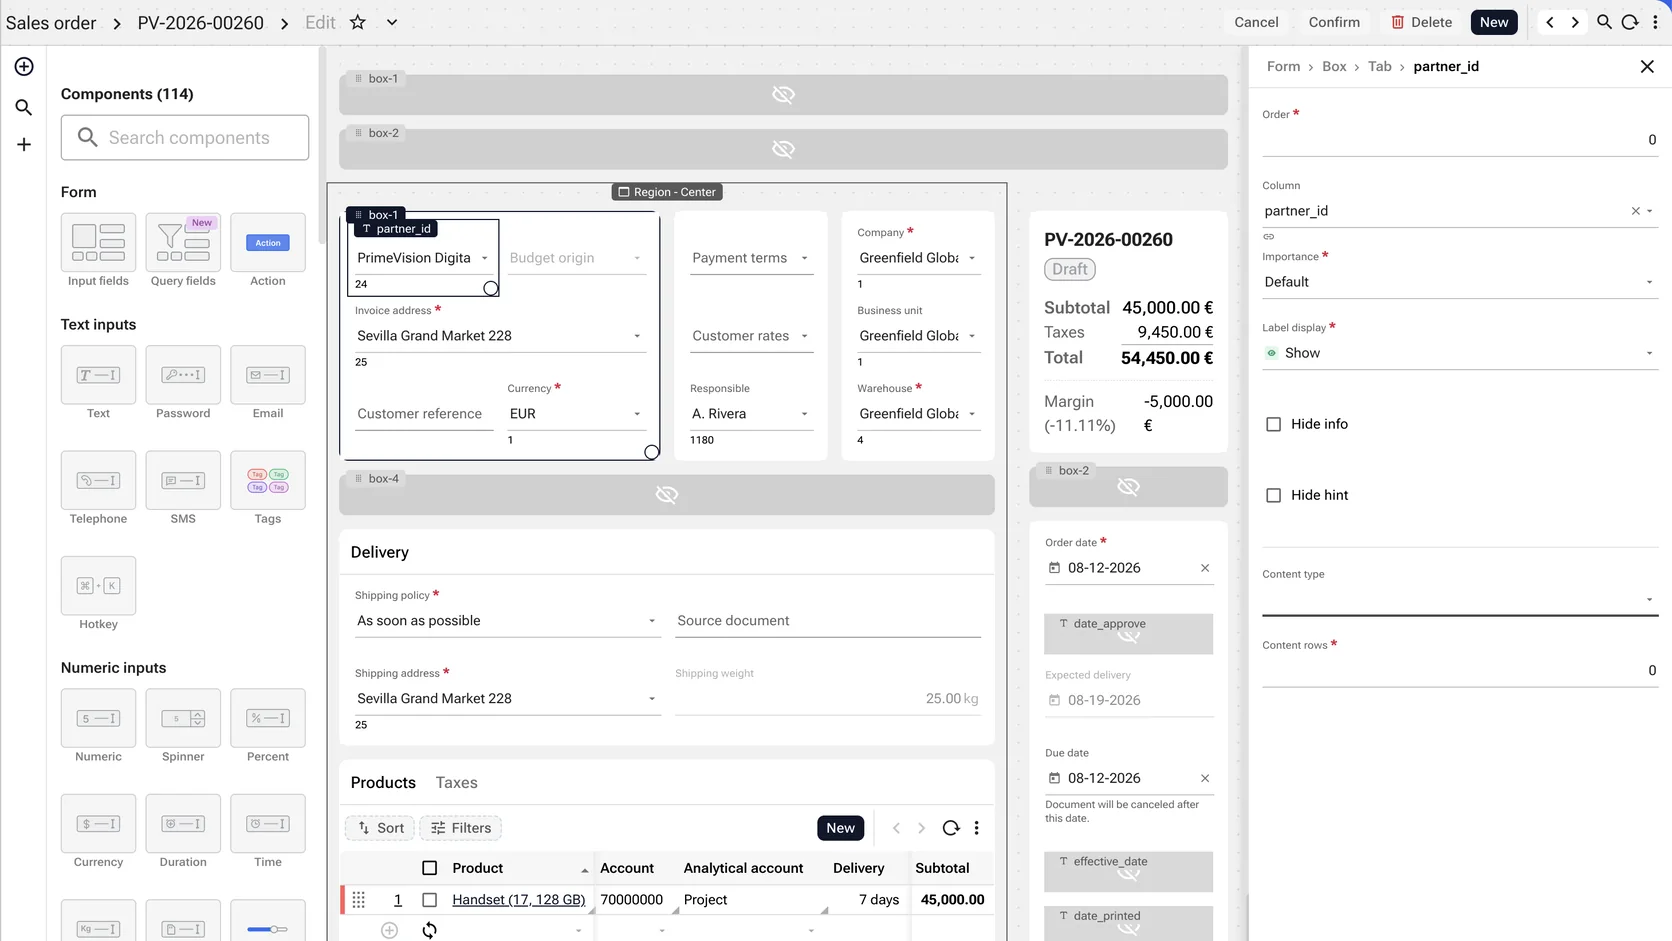
The Application Editor — the visual authoring surface
Component palette, organised by category
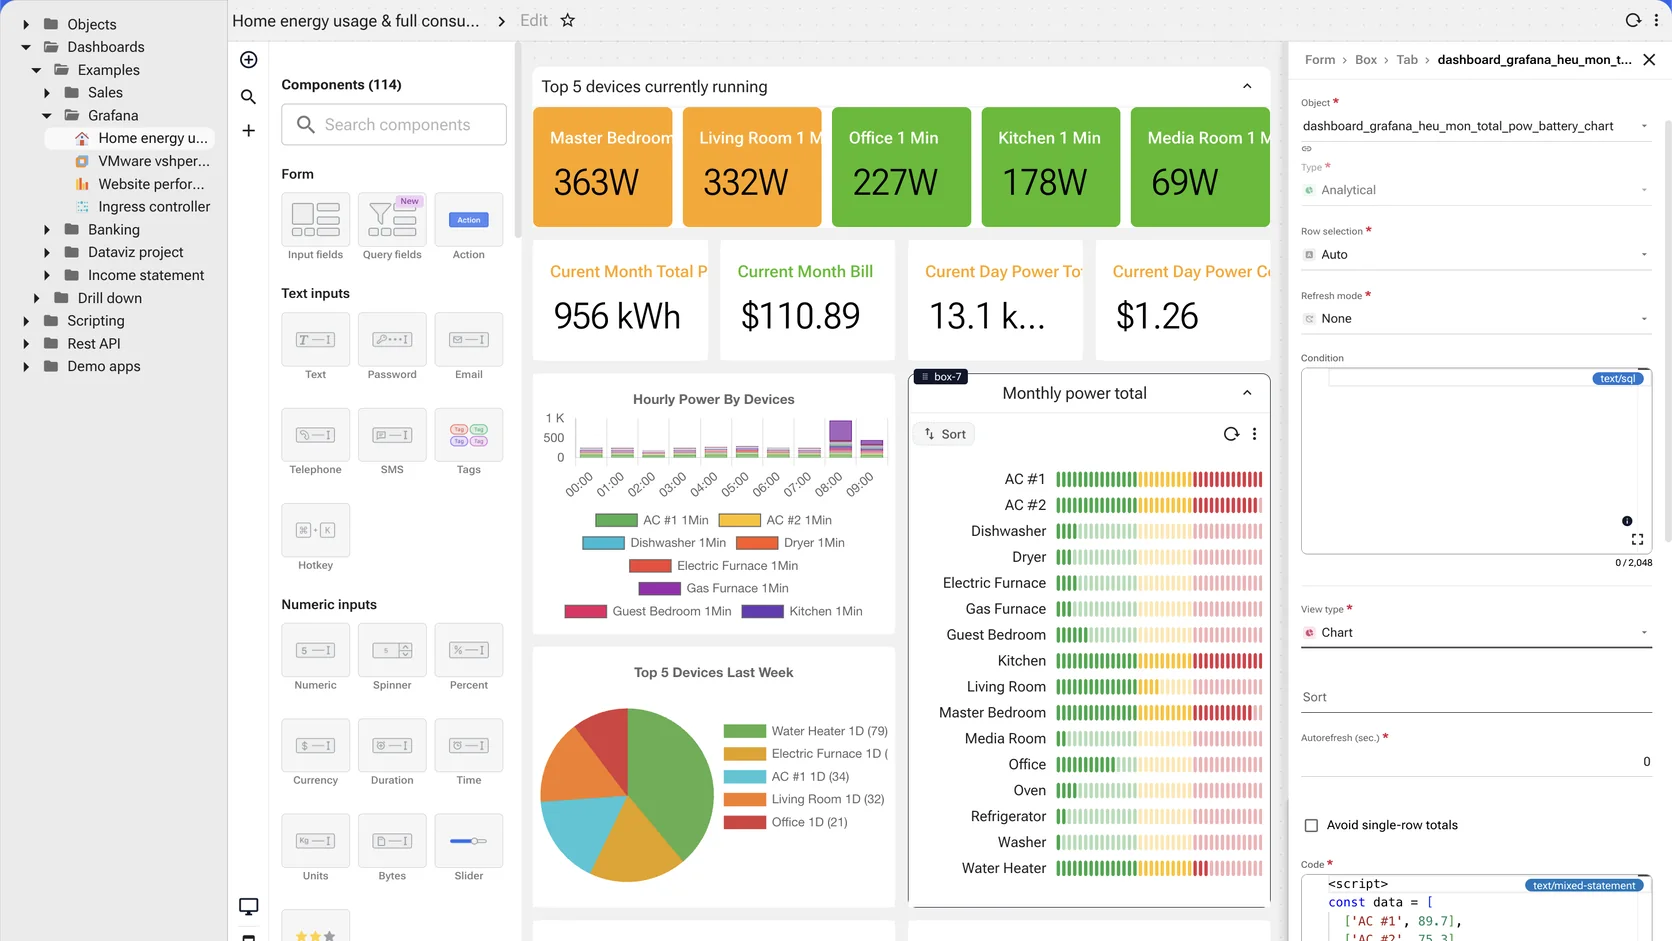
The left sidebar is a palette of 114 pre-configured components in 12 groups: form, text inputs, numeric inputs, select inputs, date inputs, special inputs, colour inputs, data views, charts, micro charts, file previews and widgets. Search filters the whole catalogue as you type. The span is the point — a currency input and a Sankey diagram, signature capture and an SSH terminal, all in one drawer.
Five-region canvas — centre, north, south, east, west
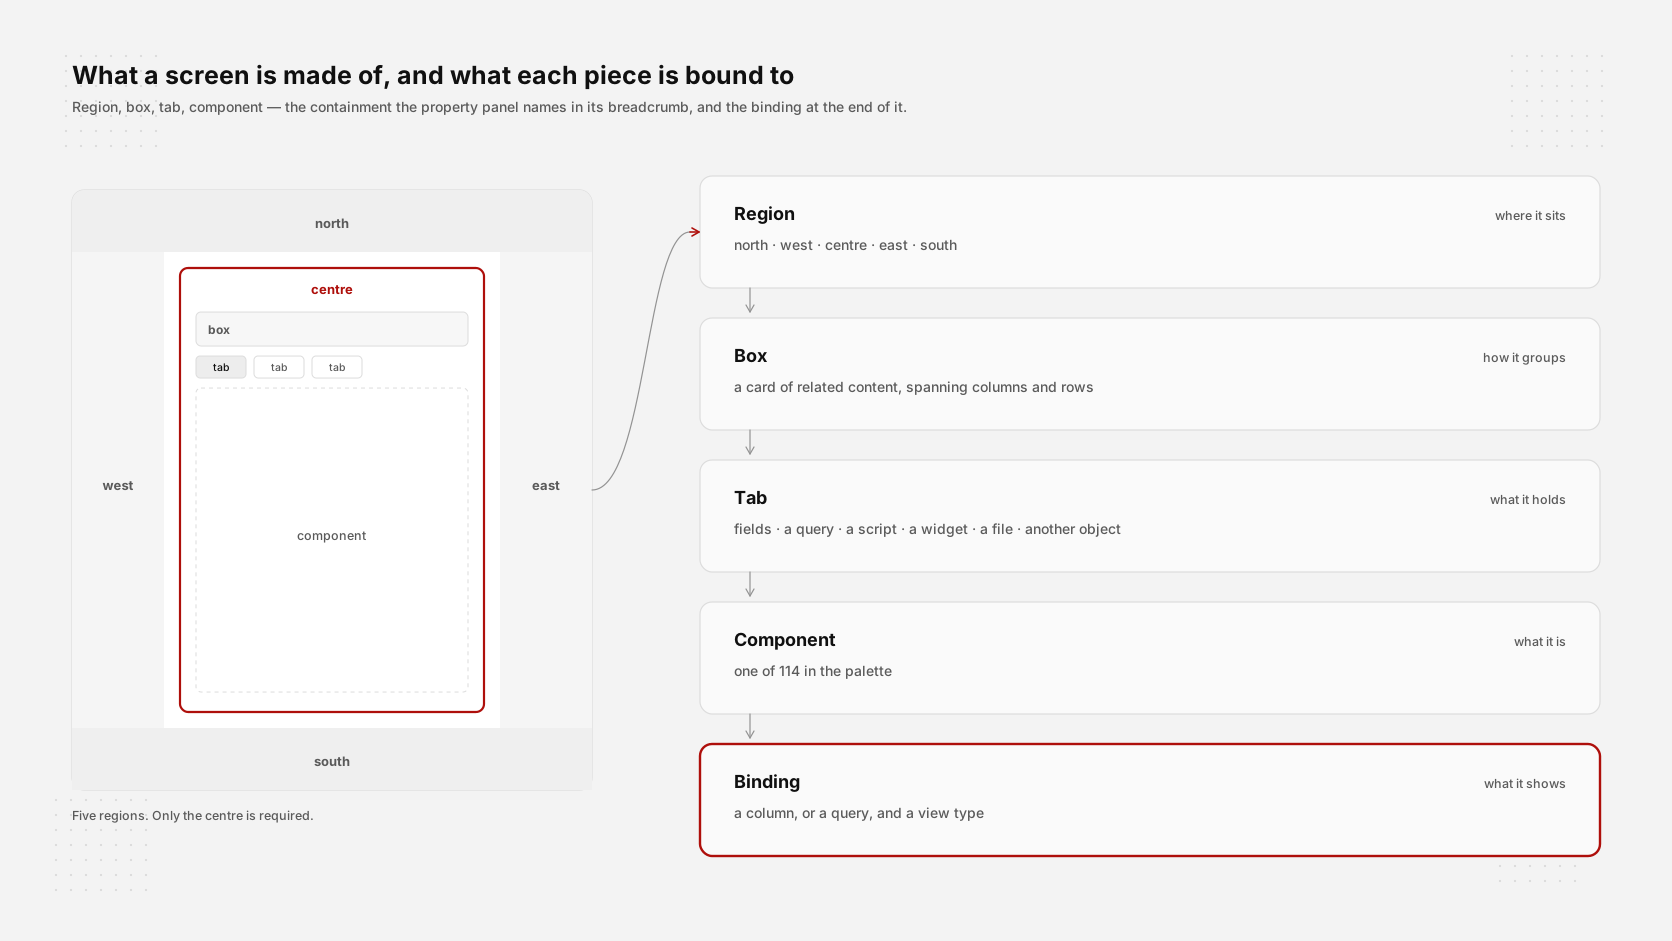
The canvas exposes five regions: a centre for the principal content, a north for the header band, a south for the footer band, an east for context panels, a west for navigation or related-data lists. Components are placed into the region the layout requires. The form designer thinks in regions; the consultant composes in those regions.
Wire to a column or to a dataset
Each component has a property panel where it is wired to the data it represents — a column from the form's primary table, a dataset returned by a query, a sub-cursor for a master-detail relationship. The component's behaviour follows from the wiring. Components do not have to be coded against the data; they are configured against it.
Foreign-key columns suggest autocomplete by default
When a column is part of a foreign key, the editor recognises the relationship from the metadata repository and suggests the autocomplete widget — a search-as-you-type input bound to the parent table. One click wires the component to the lookup; the platform does the SQL, the caching, the keyboard handling and the audit trail.
What a screen is made of, and what each piece is bound to
The component catalogue — classified by what each one does
The editor's drawer groups these twelve ways, because that is how a consultant reaches for them. Below they are classified by what they are for, which is how a reader should judge them. Any of them is placed on a form layout and bound to a column or to a dataset. The counts add to the drawer's own 114, with one addition: the schematic map is a view type in its own right rather than a setting on the geographic one, so it is listed separately here.
Form containers · 3
Input fields, query fields and actions. The primitives that turn a metadata record into a working screen: the block a user types into, the block they search with, and the button that does something.
Inputs · 33
Text 7 — text, password, email, telephone, SMS, tags, hotkey. Numeric 10 — numeric, spinner, percent, currency, duration, time, units, bytes, slider, rating. Select 7 — select, choice, check box, switch, item group, stepper, button group. Date 3, special 4 (file, image, signature, range slider) and colour 2. These are worth listing rather than showing: an input matters when someone is typing into it.
Tabular and record views · 5
Table, report, analytical grid, grid transposed and list. The surfaces that present rows as rows — and the analytical grid is where an operational user spends the day, which is why it has a section of its own below.
Hierarchy views · 2
Tree and tree grid. Structure that nests — a reporting line, a bill of materials, a chart of accounts, a folder — presented as the hierarchy it is rather than flattened into a list with an indent column.
Temporal and workflow views · 5
Calendar, Gantt, timeline, Kanban and checklist. Time and work state, which are a different question from measurement: when, how long, in what order, and where it has got to.
Geographic maps · 1
The map view against a tile provider, for subjects that genuinely have a position on the earth. Markers, shaded regions, density, and tracks animated over time. The geometry is a column in the operational database, so this is a view over an ordinary query rather than an export to a mapping tool.
Schematic maps · 1
A separate view type, not a setting on the one above. Supply an SVG and name its regions to match a column — a floor plan, a seat map, a cut diagram, a plant schematic, a wiring layout — and each region takes its colour from the query. Some inventory is only comprehensible in its own geometry, and no amount of latitude helps.
Presentation views · 3
Cards, analytical card and HTML. For when the item has to look like the item rather than like a row — catalogue, point of sale, product master — or when a single figure is the whole answer.
Charts · 32
Grouped below by what they encode rather than by shape: magnitude, change over time, part to whole, distribution, correlation, hierarchy, flow and network, and radial. Bar and stacked bar in both orientations, line, area, pie, half pie, dot, scatter, waterfall, battery, funnel, calendar, correlogram, heatmap, treemap, sankey, sunburst, radar, polar area, radial stacked bar, chord, circle packing, dendrogram, flow chart, graph, process flow, indented tree, tangled tree, org chart and magic quadrant.
Micro charts · 16
Bar, line, area, pie, distribution, battery, progress, double percent, circle, dial, gauge, ball, rating, min-max, min/max range and JSON range — each small enough to render inside a single grid cell, so a table reads as a dashboard without becoming one.
File previews · 9
PDF, image, video, audio, HTML, text, Excel, email and 3D. The attachment on a record renders in place — no download, no external viewer, and nothing leaving the permission perimeter to be read.
Widgets · 5
Diff, chat and an SSH terminal, plus two custom slots — a REST app and an HTML box. A terminal and a diff viewer sitting in the same drawer as a currency field is the clearest available statement of what this platform is built for.
Why design lives inside the platform, not in a separate IDE
Most application platforms separate the design tool from the runtime. The design tool is a desktop application, or a different web application, or a code editor; the consultant authors there, exports a build, deploys to a runtime. Each seam costs time, costs accuracy, and creates a window in which the design tool and the runtime disagree about the state of the application.
The platform collapses the seams. The Application Editor is a URL inside the same web application the consultant is authoring. The save writes to the same metadata repository the runtime reads from. The next request on any node renders the new version. The design tool is the runtime, looking at itself. The application materialises as it is composed.
The role profile that builds an application
A consultant fluent in data models and SQL can author a complete application — the forms, the grids, the validation, the role-based visibility, the audit trail. The component palette provides the surface; the metadata repository provides the wiring; the platform provides the rendering. The composition is configuration, not code.
Business logic — an invoice-posting batch, a complex period close, a tax calculation that has to match a specific country's regulation — is still authored by engineers, in JavaScript, Python, Groovy or the business 4GL, against the platform's standard library of more than forty namespaces. Front-end engineering, however, is structurally absent: there is no front-end code to develop, because the front end is configured visually and rendered from configuration.
The economic implication is straightforward. The team that ships an application becomes the team that engineers the data and the business rules — not a team padded with the full-stack front-end work that traditional enterprise applications require. The cost structure of the application changes; the time-to-ship changes; the quality of the front-end surface stops being an individual developer's opinion and becomes the company's design system, enforced by construction.
Engineering separation of concerns, not a configuration shortcut
The platform is opinionated about which decisions belong to configuration and which belong to engineering. Form layout, field types, role-based visibility, audit wiring, validation on individual columns — configuration. Business logic, tax rules, batch scheduling, integration with external systems — engineering. The platform makes the right place obvious, and the wrong place difficult.
The portfolio looks like one product because individual developers and individual business users do not get to redesign the application each time. The constraints are the value.