Every surface an enterprise application needs, and one way of making all of them.
A browser-based Application Editor, a palette of 114 components in 12 groups, and a canvas of five layout regions. Forms, grids, dashboards, planning views, maps, charts and reports are all composed through the same surface against the same metadata, and the pages below take each family in turn. Save an artefact and the next request renders it: no build, no restart, no window.
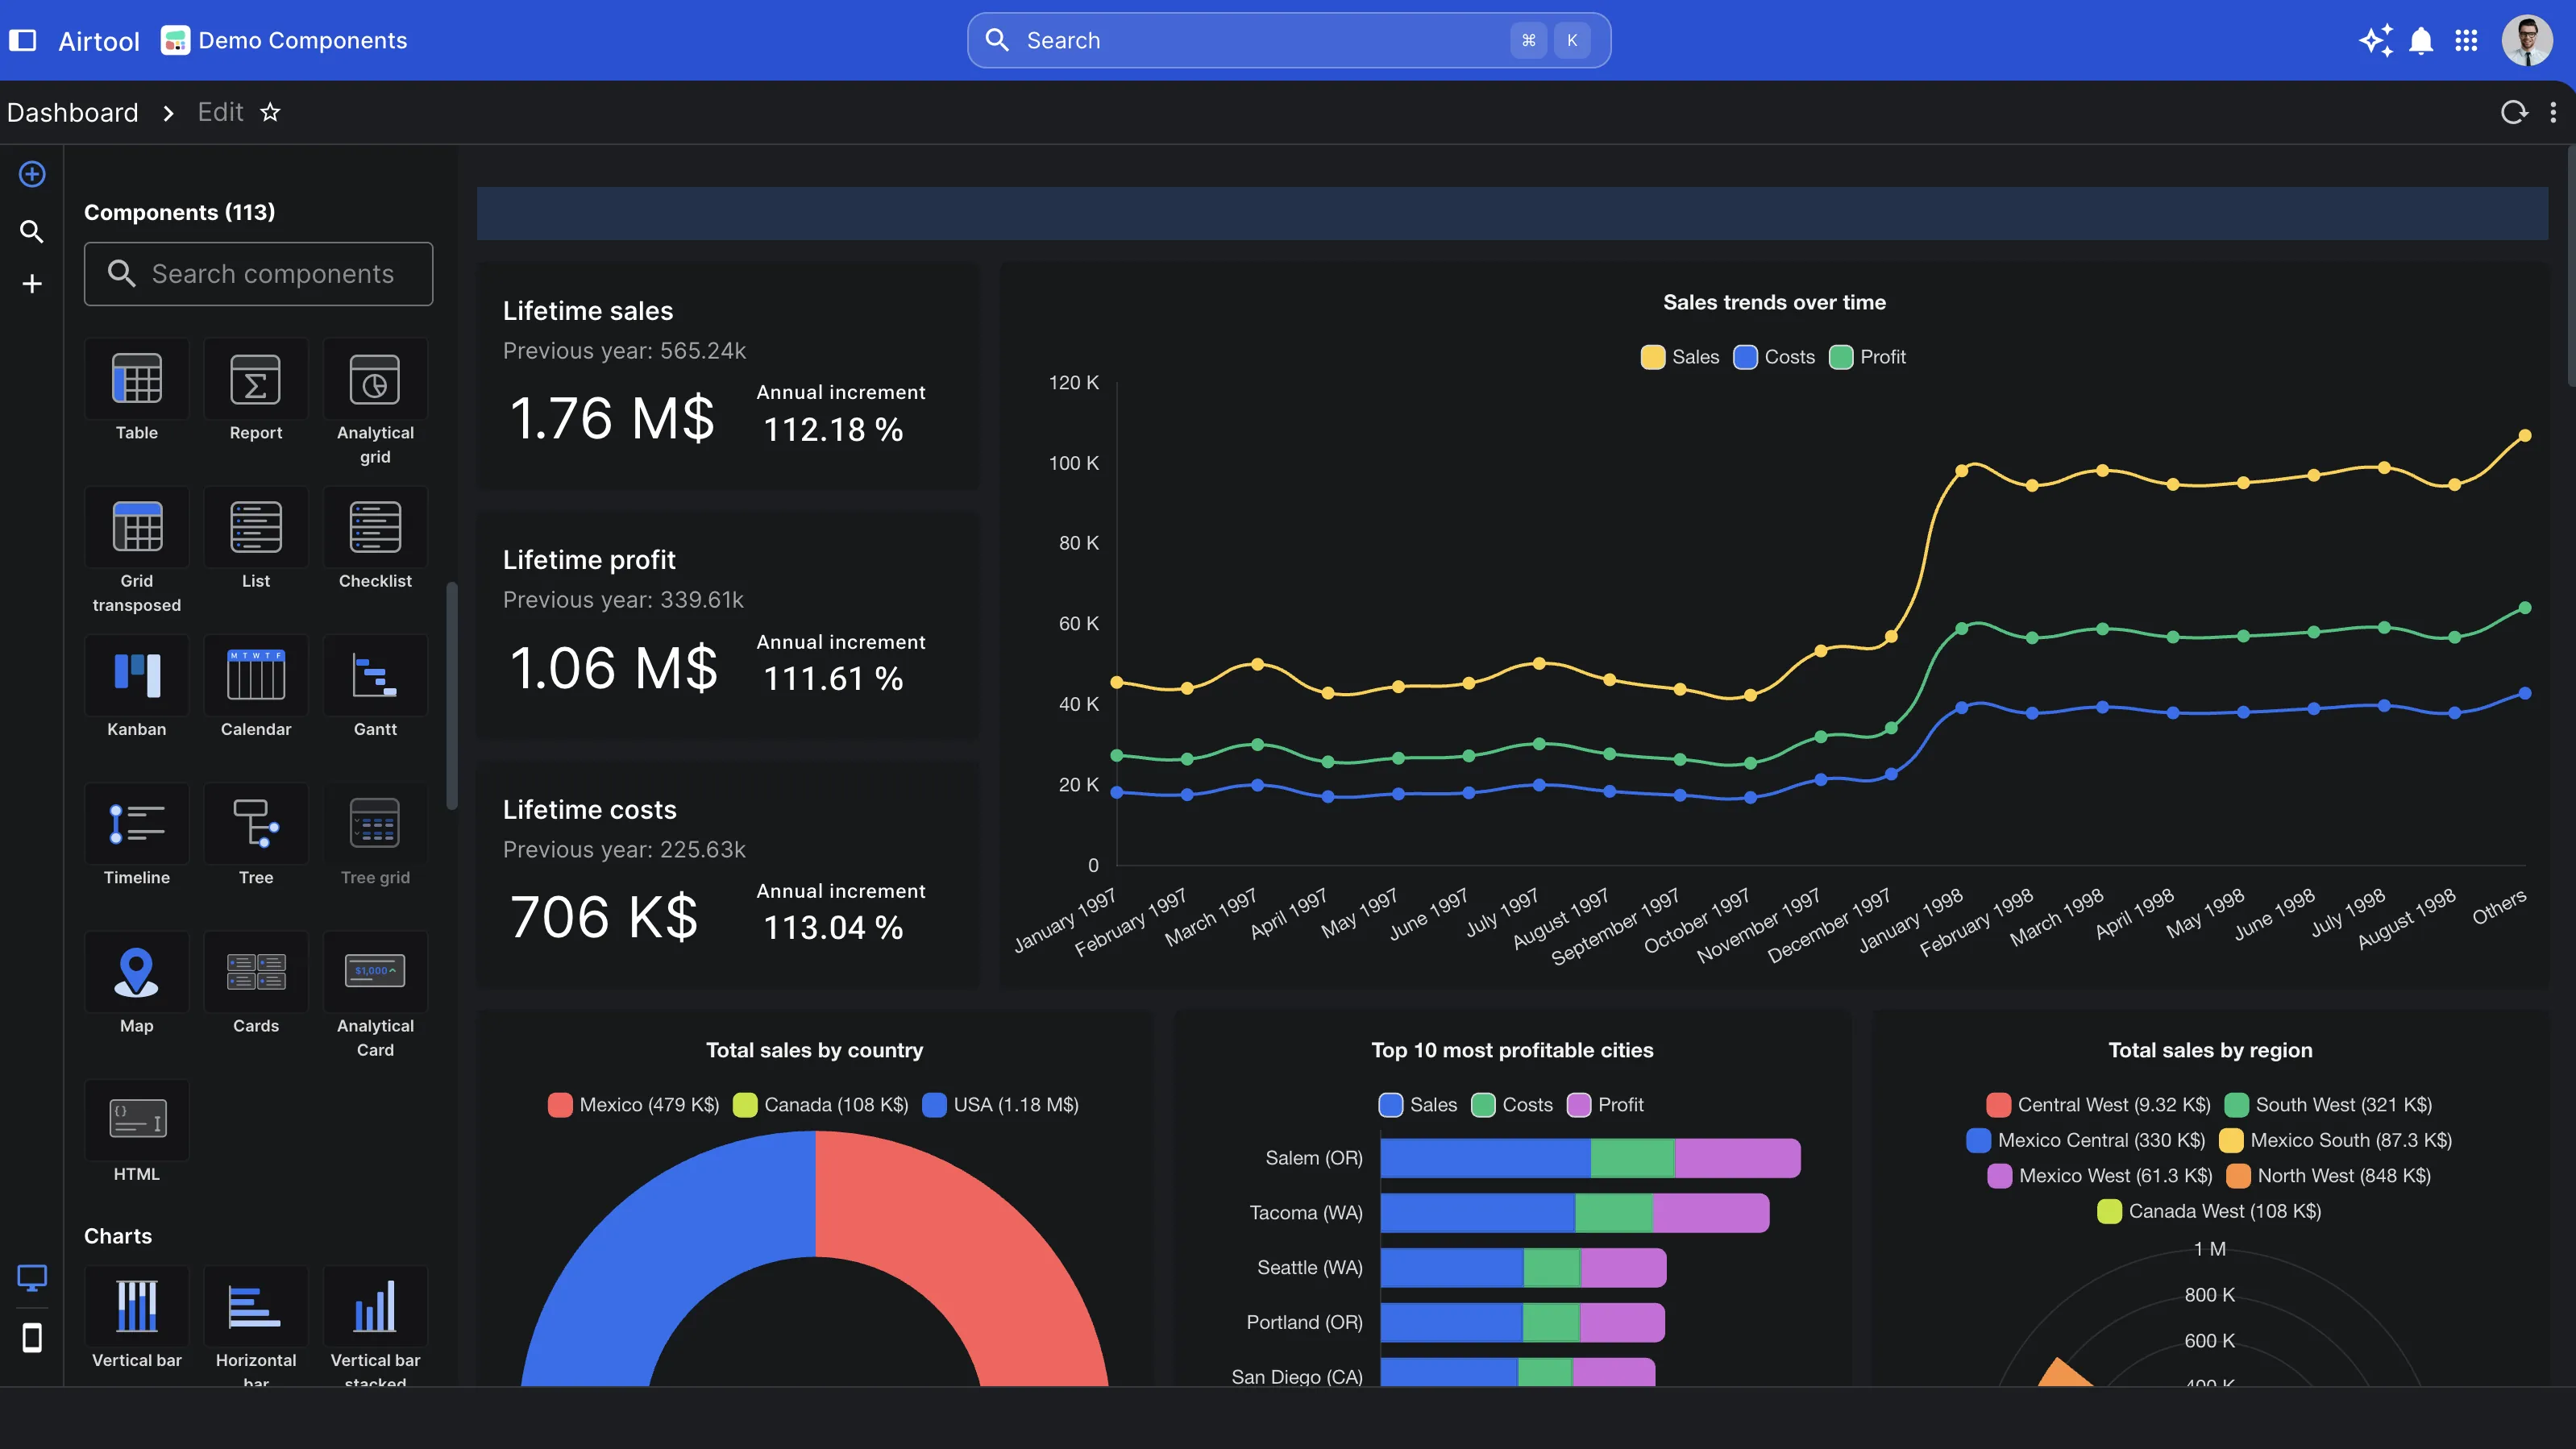
One editor, every surface
Forms, grids, dashboards, planning views, maps, charts, reports and the server-side scripts behind them are authored through the same browser tool, against the same metadata. No local install, no toolchain, and no second product to learn when the question changes from data entry to analysis.
A view type is a property, not a project
The same result set renders as a grid, a calendar, a Gantt, a board, a map or a chart because the view is a setting on the object. Reading the data a different way costs a change to a record, not a new screen and a second copy of the query.
Materialises on the next request
Save the artefact and the metadata is written to the repository with the cache invalidated across the cluster. Open sessions continue on the version they loaded; the next request renders the new one. No build, no restart, no window.
One permission model underneath all of it
A chart is a query, a form field is a column, a map region is a row. Each runs under the reader's role with the same audit trail, so no surface can show what another would refuse.
What the UI layer can do, surface by surface
Nine surfaces, each with a page carrying its own evidence from the running product. The headings are links; the lines beneath them are what that surface actually does, not what it is called.
The Application Editor
A palette on the left, a canvas of five layout regions in the middle, a property panel on the right. Place a component, bind it to a column or a query, save. The same tool authors the server-side scripts and scheduled work behind the screen, so there is one surface rather than one per artefact type.
Components
114 in 12 groups, from a currency field to a Sankey diagram, signature capture to an SSH terminal. Not a list on a website — the drawer that opens in the editor on any running page, searchable and grouped as it is there.
Inputs
33 components across text, numeric, select, date, special and colour. A currency that formats itself, a duration that understands elapsed time, a signature that evidences an approval — and three input styles the company sets and may leave to the reader.
Forms
Regions, boxes, tabs and fields; a header whose actions follow the record's state; collections that are the grid rather than a table drawn to look like one; alerts that quote the row they sit on; and fields that hide behind a Show more until wanted. The dashboard and the search screen are the same construction.
The grid
Server-paginated to any size or held client-side for the set actually being interrogated. Scrolls without paging, groups and sorts on the reader's choice, carries statistics in the header, renders charts inside cells, copies out to a spreadsheet, edits in place, and opens a row onto its own children.
Views
Calendar, Gantt, timeline, board, process flow and flowchart for work that has a shape in time. Catalogue views for when the item has to look like the item rather than like a row. And media views, which open a document, a message, a recording or a 3D model inside the record that owns it.
Maps
Markers, shaded regions and tracks on real cartography, with the tile provider a choice. And schematic maps: supply a floor plan, a seat map, a cut diagram or a plant schematic, name its regions to match a column, and each region takes its colour from the query.
Charts
Thirty types in eight families — magnitude, change over time, part to whole, distribution, correlation, hierarchy, flow and network, radial. Sixteen more are small enough to render inside a single grid cell, which is what lets a table read as a dashboard without becoming one.
Why a screen is composed here rather than written
Every claim above reduces to the same one. A screen in this platform is a record: which components, where on the canvas, bound to which columns, visible under which conditions, to which roles. Nothing on it is markup that somebody wrote and somebody else will have to find.
That is what makes a view type a property rather than a project, and what makes a dashboard turn out to be a form. It is also what makes the count of components meaningful — 114 is not a boast about breadth, it is the size of the vocabulary a consultant composes from without writing front-end code at all.
The trade is real and worth stating. A surface the platform does not have is not one afternoon away; it is a component, and components are engineered. What the model buys is that the hundreds of screens an enterprise application actually needs are configuration, so the engineering effort concentrates where it is genuinely required instead of being spent again on the four hundredth form.